


The Triple Drill-Down Bar Chart is a smart way to let your audience explore data across three hierarchical levels without cluttering the report or overwhelming them with filters.
In this blog, we’ll walk through how to create a Triple Drill Down Bar Chart in Power BI, enabling users to explore their data across three levels of granularity, all within a single, interactive visual.
Key Steps
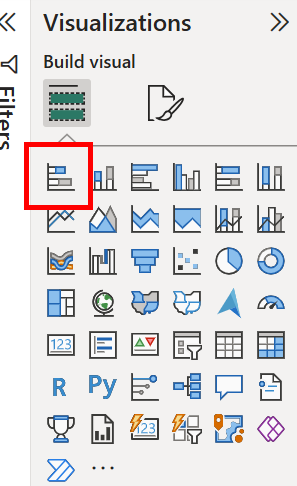
Step 1 ➡ Select bar chart in the visualisations pane.
Step 2 ➡ Identify the measure by which you are analyzing your drill-down metrics, and then add it to the X-Axis.
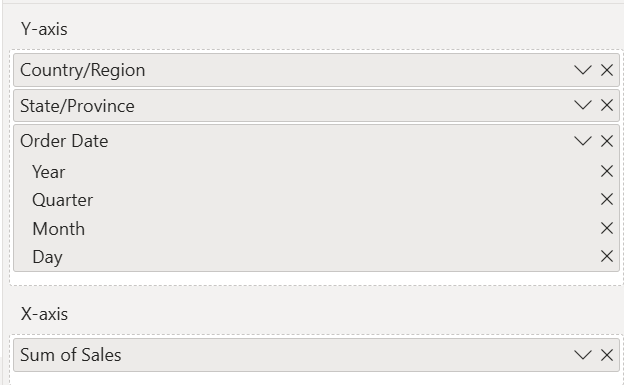
Step 3 ➡ Identify the three drill-down metrics, and then add these to the Y-Axis. It is important to note that the order by which you place these from top to bottom, is the order by which you will be drilling down into them.
Step 4 ➡ Turn on your drill-down and then select the bar to drill deeper into your metrics.
Time to Build
We are going to build a triple-drill down bar chart using 'Sample-Superstore' data enabling the user to view Sales by drilling down into different countries, into states, and then further allowing them to view this overtime (by year).
Step 1 ➡ Select bar chart in the visualisations pane:
Step 2 ➡ Identifying our measure that we are analyzing our drill-down metrics by.
So for this scenario it will be: Sum of [Sales] - so we add this to our X-Axis.
Step 3 ➡ Identifying the three drill-down metrics, and adding these by order of which we want to drill down into them, to the Y-Axis.
So for this scenario it will be: [Country/Region] , [State/Province], and [Order Date]. Power BI will automatically bring in all the levels of granularity of the [Order Date], so remove the Day, Month and Quarter.
Step 4 ➡ Turn on your drill-down and then select the bar to drill deeper into the metrics.
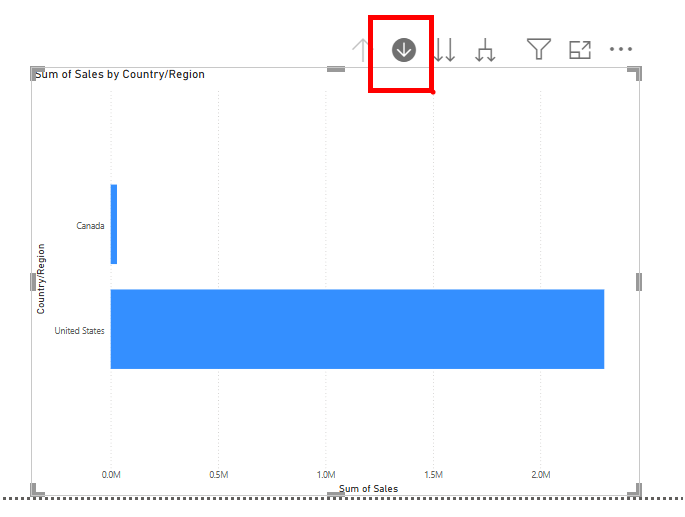
Once you have completed all these steps, you can click away on the bars/double-arrows to drill-down into the metrics you desire.
Some further key points to note include:
. If you select the double-arrow drill down button rather than selecting your bar, you will receive either: all of the available strings e.g. in this scenario all Canadian provinces and US states, or you will receive a sum of all data form the previous drill-down if the next level in the hierarchy is numeric.
. Performance considerations: larger drill-down levels within large dataset reports may slow down visuals.
. Ensure you are using them at the appropriate time: triple drill downs allow the user to delve deeper into different levels of granularity, but this doesn't allow user to compare between different metrics in the same view. So be sure that a drill-down is the suitable visualisation selection.
. Ensure users are aware there is a drill down feature on the graph, as it may be hard to know just by looking at the report.