


One thing that caught my attention while working in Power BI last week was how a measure behaves when a slicer is applied to the same field it references. By default, a slicer will filter most visuals on your report page. But when you wrap your measure in a CALCULATE function using ALL, it removes that filter context, meaning the measure holds its value regardless of what the user selects in the slicer.
A simple example looks like this:
All Category Sales = CALCULATE([Total Sales] , ALL(Categories[Category]))
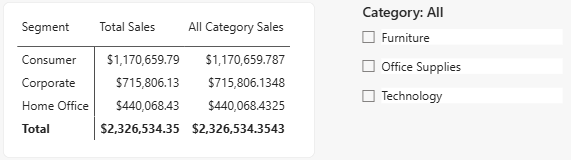
What makes this useful is that it lets you keep a fixed total or baseline value visible on your dashboard even as the user interacts with slicers to explore different cuts of the data. Think of it as an anchor, something that gives context to whatever the slicer is highlighting at any given moment.
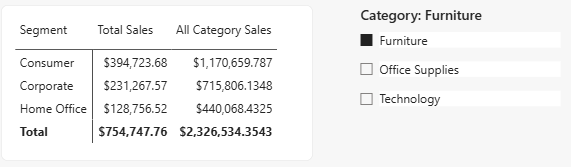
This only applies when the slicer is based on the field referenced inside your measure. Slicers on unrelated fields will still interact with your visual as normal. Nevertheless, it's a handy tool for building reports where you want to compare a filtered view against a consistent overall picture. In essence, seeing the forest for the trees.