


Recently, I was tasked with creating a configuration window within Tableau that would allow the user to select records from a table, storing them for later use in a second dashboard. This was quite a fun and interesting experience, so I’ve decided to publish a walkthrough detailing how to create something similar!
Creating the table
I’ve used mockaroo to create some fake data with three fields: ID, Year, and Review.
Start by building the table that displays your reviews (or whatever data you're working with). This table will form the foundation for the interactive selection window. The mark type will be shape, and the shape will indicate whether or not a review has been selected.

Add a dynamic selection mechanism
Since each review is uniquely identified by an ID, we'll create a set based on this field. The set will store the reviews the user selects.
To demonstrate how this works, add a sample ID to the set. This allows you to see the behavior of a "selected" review right away.

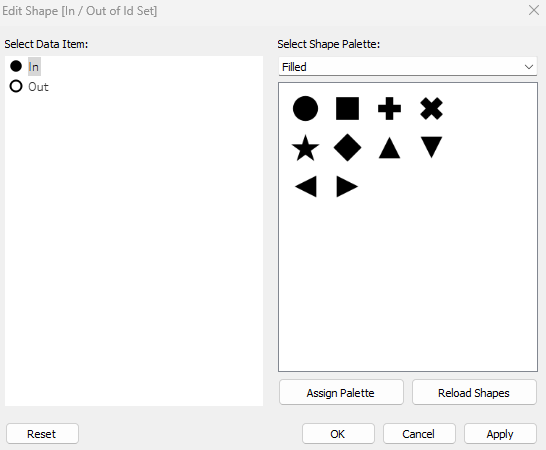
Now we'll drag the set onto the Shapes mark. I’ve used filled circles to indicate selected reviews and empty circles for unselected ones. This simple visual cue helps the user quickly distinguish between selected and unselected entries.
Set up selection actions
We’ll need two dashboard actions: one for selecting and one for deselecting reviews.
Selection Action
This action is straightforward: when a review is clicked, it gets added to the set. Configure it to run on select.

Deselection Action
This part is a bit trickier. We can’t run the deselection action on select because it would conflict with the selection logic. Instead, we’ll run the action on menu.
While not perfect (ideally both actions would trigger on selection), it works well enough for our purpose.

Tip: Be intentional when naming your menu action. The name will appear as the option users click.

Show the number of selected reviews
Since users can select multiple reviews, it’s helpful to display the total number of selected items. You can do this with a calculation that counts the IDs in the set.

Add this calculation to your sheet title or elsewhere in the dashboard to keep the user informed.

Optional: View all selected reviews together
In my original use case, the table always had at least one filter applied—meaning not all reviews could be viewed at once. To allow users to see all their selected reviews regardless of current filters, we’ll add a toggle feature.
First, we’ll create a boolean parameter. This parameter will control whether the user is viewing filtered data or all selected reviews. You can configure it as shown in the screenshot below.

Next, we’ll create a filter parameter.

Finally, create a calculated field that combines your boolean parameter with standard filter logic.
Here’s the calculation I made:

Once we drag this calculation onto filters and select True, our filter and our 'Show all selected' option should work perfectly!
With a bit of formatting, we’ve got a simple & unique selection window. In my use case, I visualized the selected reviews on a separate dashboard used solely for exporting purposes, but there are tons of use cases for this kind of mechanism. If I were to expand on this project, I’d consider adding a ‘clear all’ button, as well as an option to export just the selected reviews as a CSV. I may come back to this project with a few upgrades!