


Parameters are a very powerful tool in Tableau, which allow us to make our charts dynamic. They have a bunch of uses, and one of those is to make dynamic KPIs.
In this blog, I will show you how to make one such dynamic KPI using the ever-popular Superstore dataset. This particular KPI is dependent on a specific month and year, and shows the % change in profit from the same month in the previous year to the current selected month as well as the numerical values that % calculation is based on. It also displays a ▲ when there has been an increase, and a ▼ when there's been a decrease.
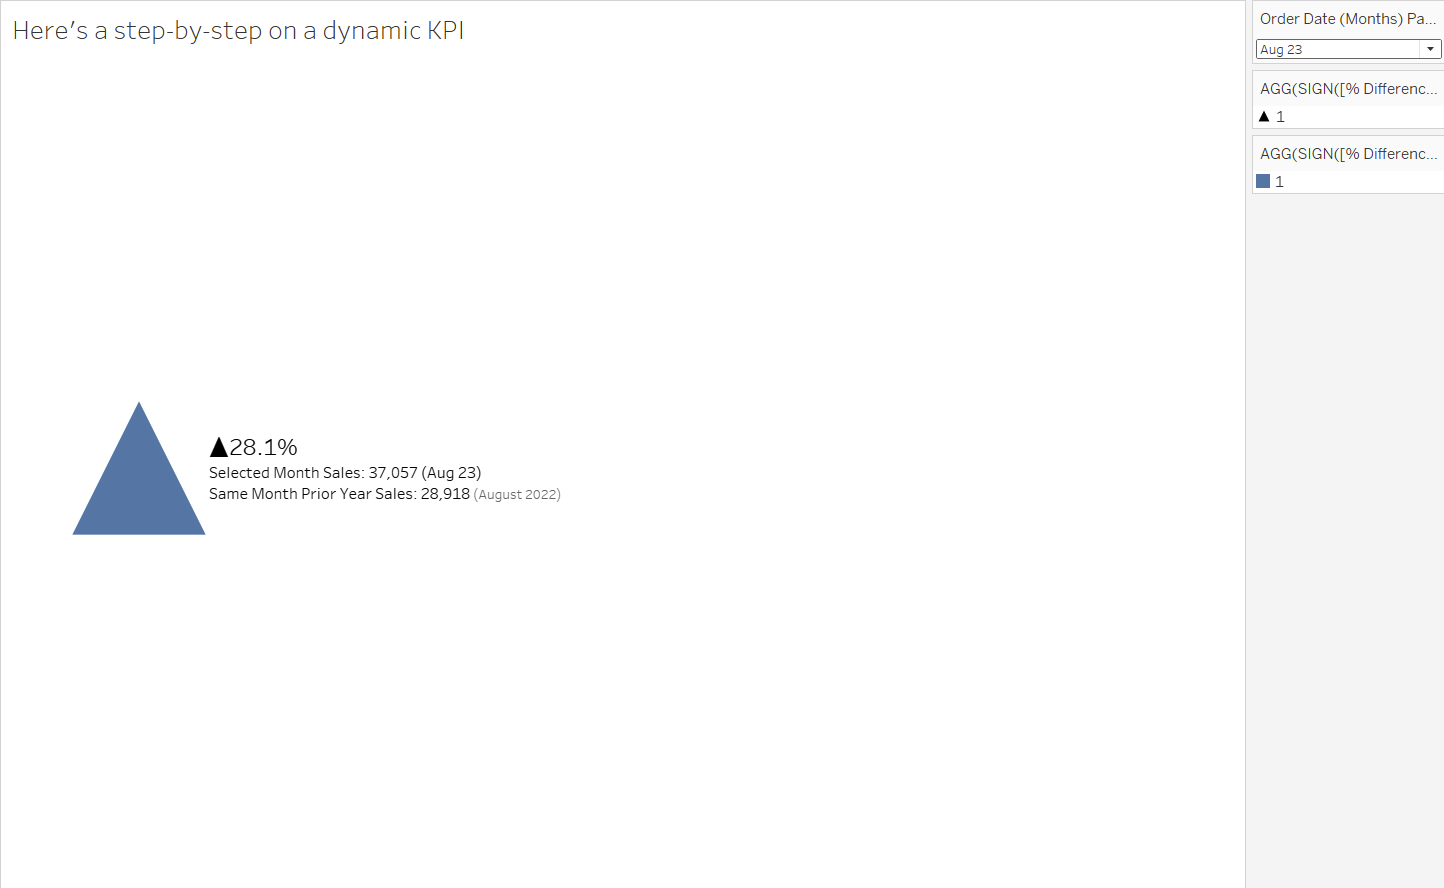
Positive change (Aug 2023):
Negative change (Oct 2023):
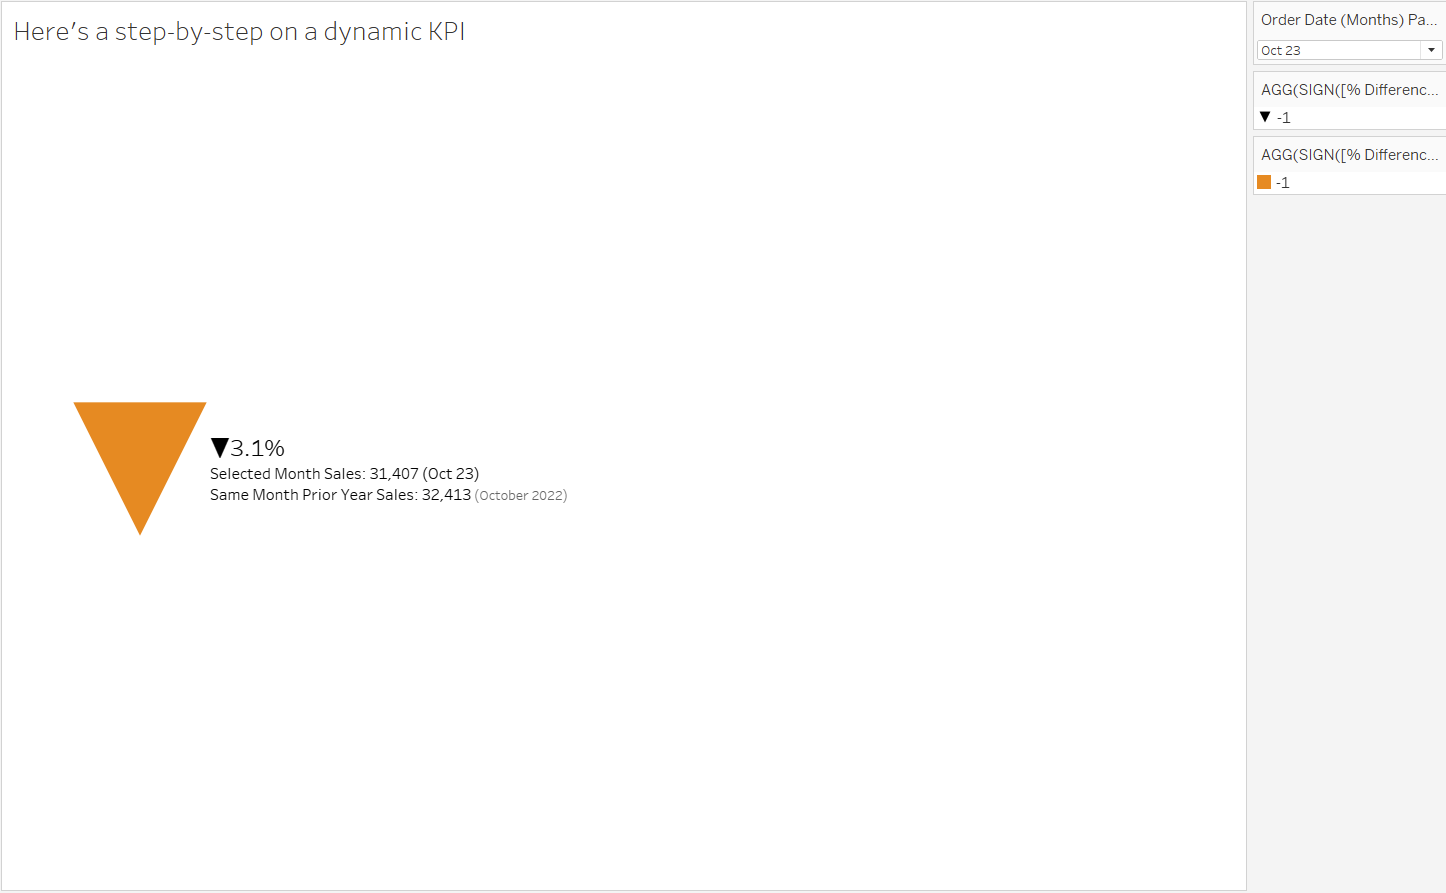
As you can see, the symbols, values and dates within the KPI are changing depending on the month we've selected in the drop down on the right.
Here's the step-by-step breakdown of how to make this...
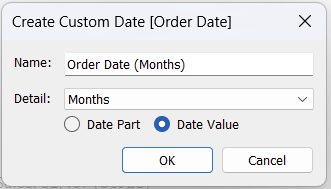
You'll need to have your Superstore data source loaded into Tableau. Once it's there, right click on Order Date > Custom Date. "Months" is the level of granularity we need, and make sure "Date Value" is checked.

Now we have a new field, Order Date (Months). But we need it to be discrete, so convert it by right-clicking then choosing "Convert to Discrete".
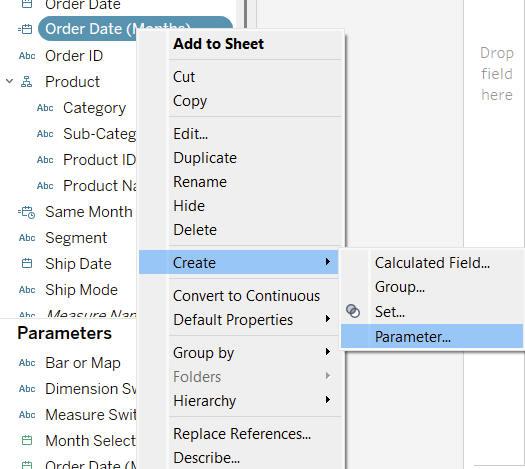
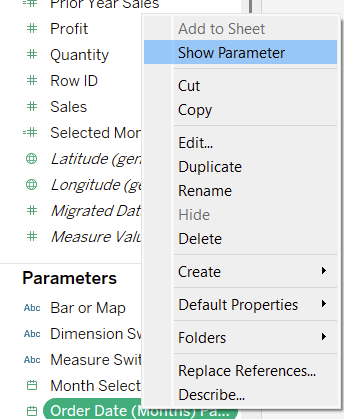
Because we’ve made this new auto-aggregated field, we can use it directly in a parameter. We can do this by right-clicking on the variable, then choosing Create > Parameter…
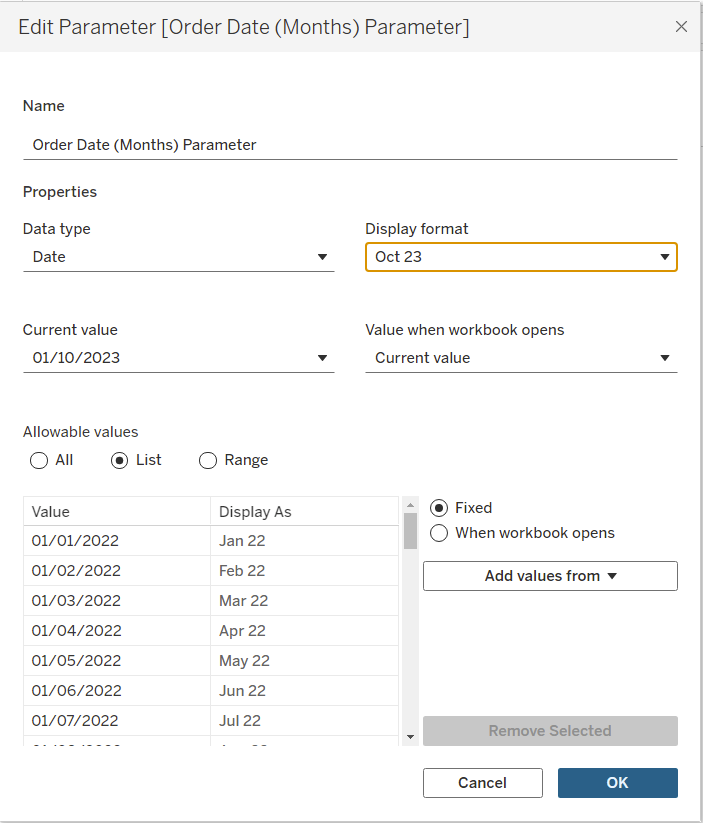
By doing this, most of our parameter should already be as we want it: a Date data type, with a list of all our dates. I have also changed the Display format to a custom one (MMM yy), but this is personal preference. We can click okay, and now our parameter will be in the data pane. We can right click on it and select "Show parameter" to bring up the drop-down list of dates to the right of the view.
We’re going to need a couple of calculated fields to access this parameter. The first of these is Selected Month Sales, written like so:

This will return the Sales value for whatever month is selected by our parameter. But we don’t just care about the current month/year: we also values from the same month in the previous year. So let’s make a second calculated field called Prior Year Sales. This works by the same logic, except we need to wrap our parameter in the DATEADD() function to get the previous year, like so:

Now that we have fields for the sales in both our current month and our previous year, we can make our % Difference Years calculation. The value we want is a percentage of the change in sales from the same month last year, which can be calculated as follows:
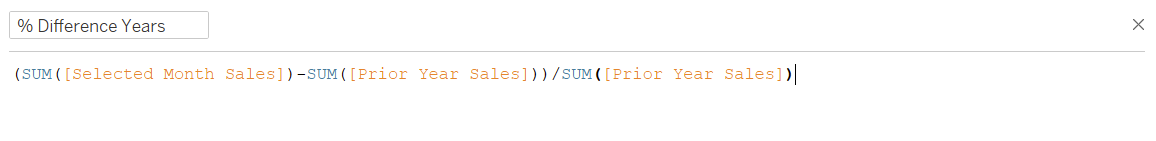
Before we do anything else with this field, we should first convert it to discrete, as the rest of our calculations won't work with a continuous field.
That's all the calculated fields we need for now! That means we can finally start building in the view. Start by changing our canvas from Standard to Entire View. Then double click on “columns” and type in AVG(-1). Don't worry too much about this; this is just to set up a canvas on which to put our KPI.
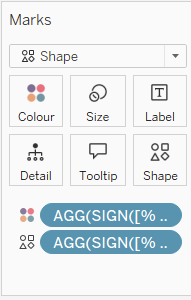
Now change the mark type to shape and drag our new % Difference Years field onto the “Shape” box.

Right now, you’ll probably see there’s an unfilled circle on your view. We need this to:
- Be a filled up arrow when the value is positive, and down when negative
- Be blue when the value is positive, and orange when negative
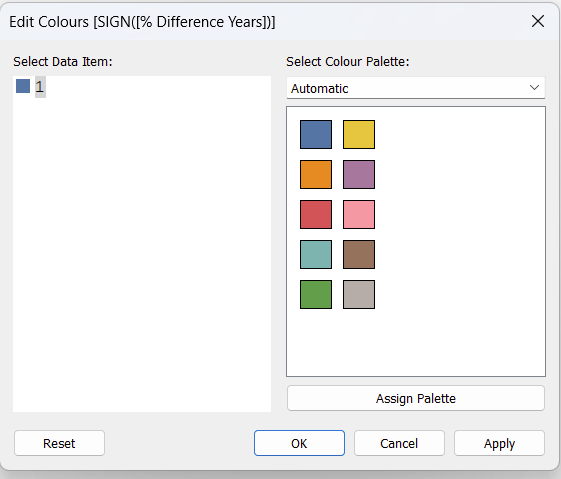
For this, we only care about whether the value is positive or negative. By wrapping our Shapes dimension in a SIGN function (SIGN([% Difference Years])), we can make the output equal 1 if positive, -1 if negative or 0 if 0. Duplicate this field onto colour as well.
Now we can select the shape/colour depending on the values. Use your parameter dropdown to select a month with a positive value (the value should be 1 on the right pane). Change the shape for 1 to a filled up arrow and the colour to blue. Then find a negative value date (-1) and repeat the steps with a filled down arrow and orange.

Now we need to work on our text. For this, we need to drag this same value onto the label. By default this will just appear as a label, but we want this to be dynamic: a nicely formatted percentage, with an up arrow if positive and a down arrow if negative. We can do this by changing the default format of the field itself to a specific custom format, as shown in the screenshots below.
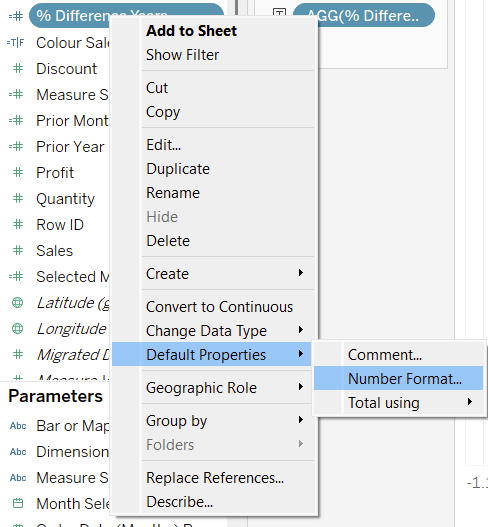

This just tells Tableau that we have three formatting scenarios, delineated by the semicolon: positive, negative, then 0 (here, we’ve told it to put no sign). These arrows are actually emojis! We can access them by using windows key + . to bring up the emotes box on windows and scrolling to symbols, or by copying and pasting ▲ and▼.
We're nearly there! But first, we need more text on our label. Specifically:
- Selected Month Sales
- Prior Year Sales
- Selected Month Date (our parameter)
- Prior Year Date
These first three we already have as calculated fields. These can simply be dragged onto the label field individually. The last one requires a new calculated field, Same Month Prior Year. Here we can just use DATEADD to calculate a year prior to the selected month, as we did in Prior Year Sales.

This calculation can then be right-click-dragged onto labels, and we want it to be Month-Year format, or MY.
With all these as labels, we can now format our label to present all this information in an aesthetically pleasing manner. And voila! We now have a nicely formatted dynamic KPI. This basic formula can be tweaked and reappropriated for a range of different applications.