


First week of training came to an end and we focused on Tableau prep.
Tableau prep can help us clean our datasets using steps.
Some of those steps are:
Clean Data
Joins & Unions
Aggregate
Pivot
SO, WHAT IS PIVOTING?
Pivoting is a technique to shape data. You can ‘rotate’ data from rows to columns or vice-versa. The way that you decide to use this tool will depend on the result that you are trying to achieve. Let’s look at rows to columns.
Rows to columns
You want to use this type of pivoting when you have a table with multiple rows in a long format within the same column. Each row represents different categories. The desired outcome is to make these categories into columns.
Why?
Simplies data structured
Help in aggregation
Summarize
Helps with certain visualizations
E.G. This is start up company who received some funds and has been running for 6 months. They spent some of those funds in marketing, advertising their products through 3 different channels: print leaflets, on television and on the internet. They want to understand how was the budget spent on each channel throughout the first 6 months. (Look at the table below)
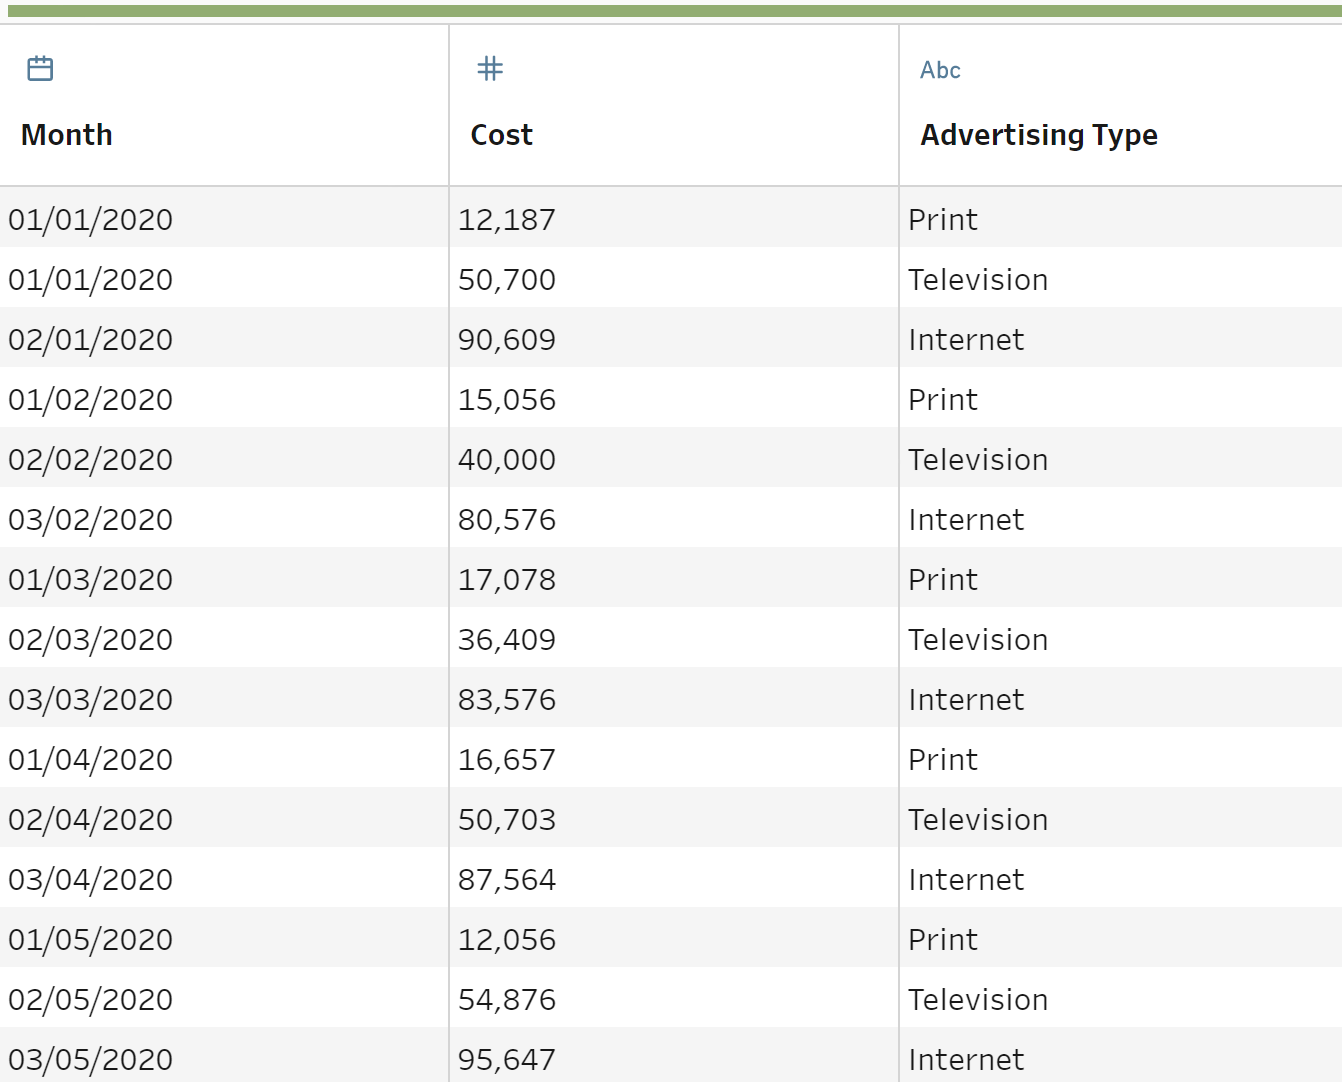
Looking at the table we can recognize that if we want to analyse how the budget was spent on television, it does not flow. We need to jump from row to row and keep track of it. So, what can we do? PIVOTING!! We want to change each "Advertising Type" from being in rows, and place each one of them in an individual column. This is were pivoting rows to columns are very handy! (Look at the image below)
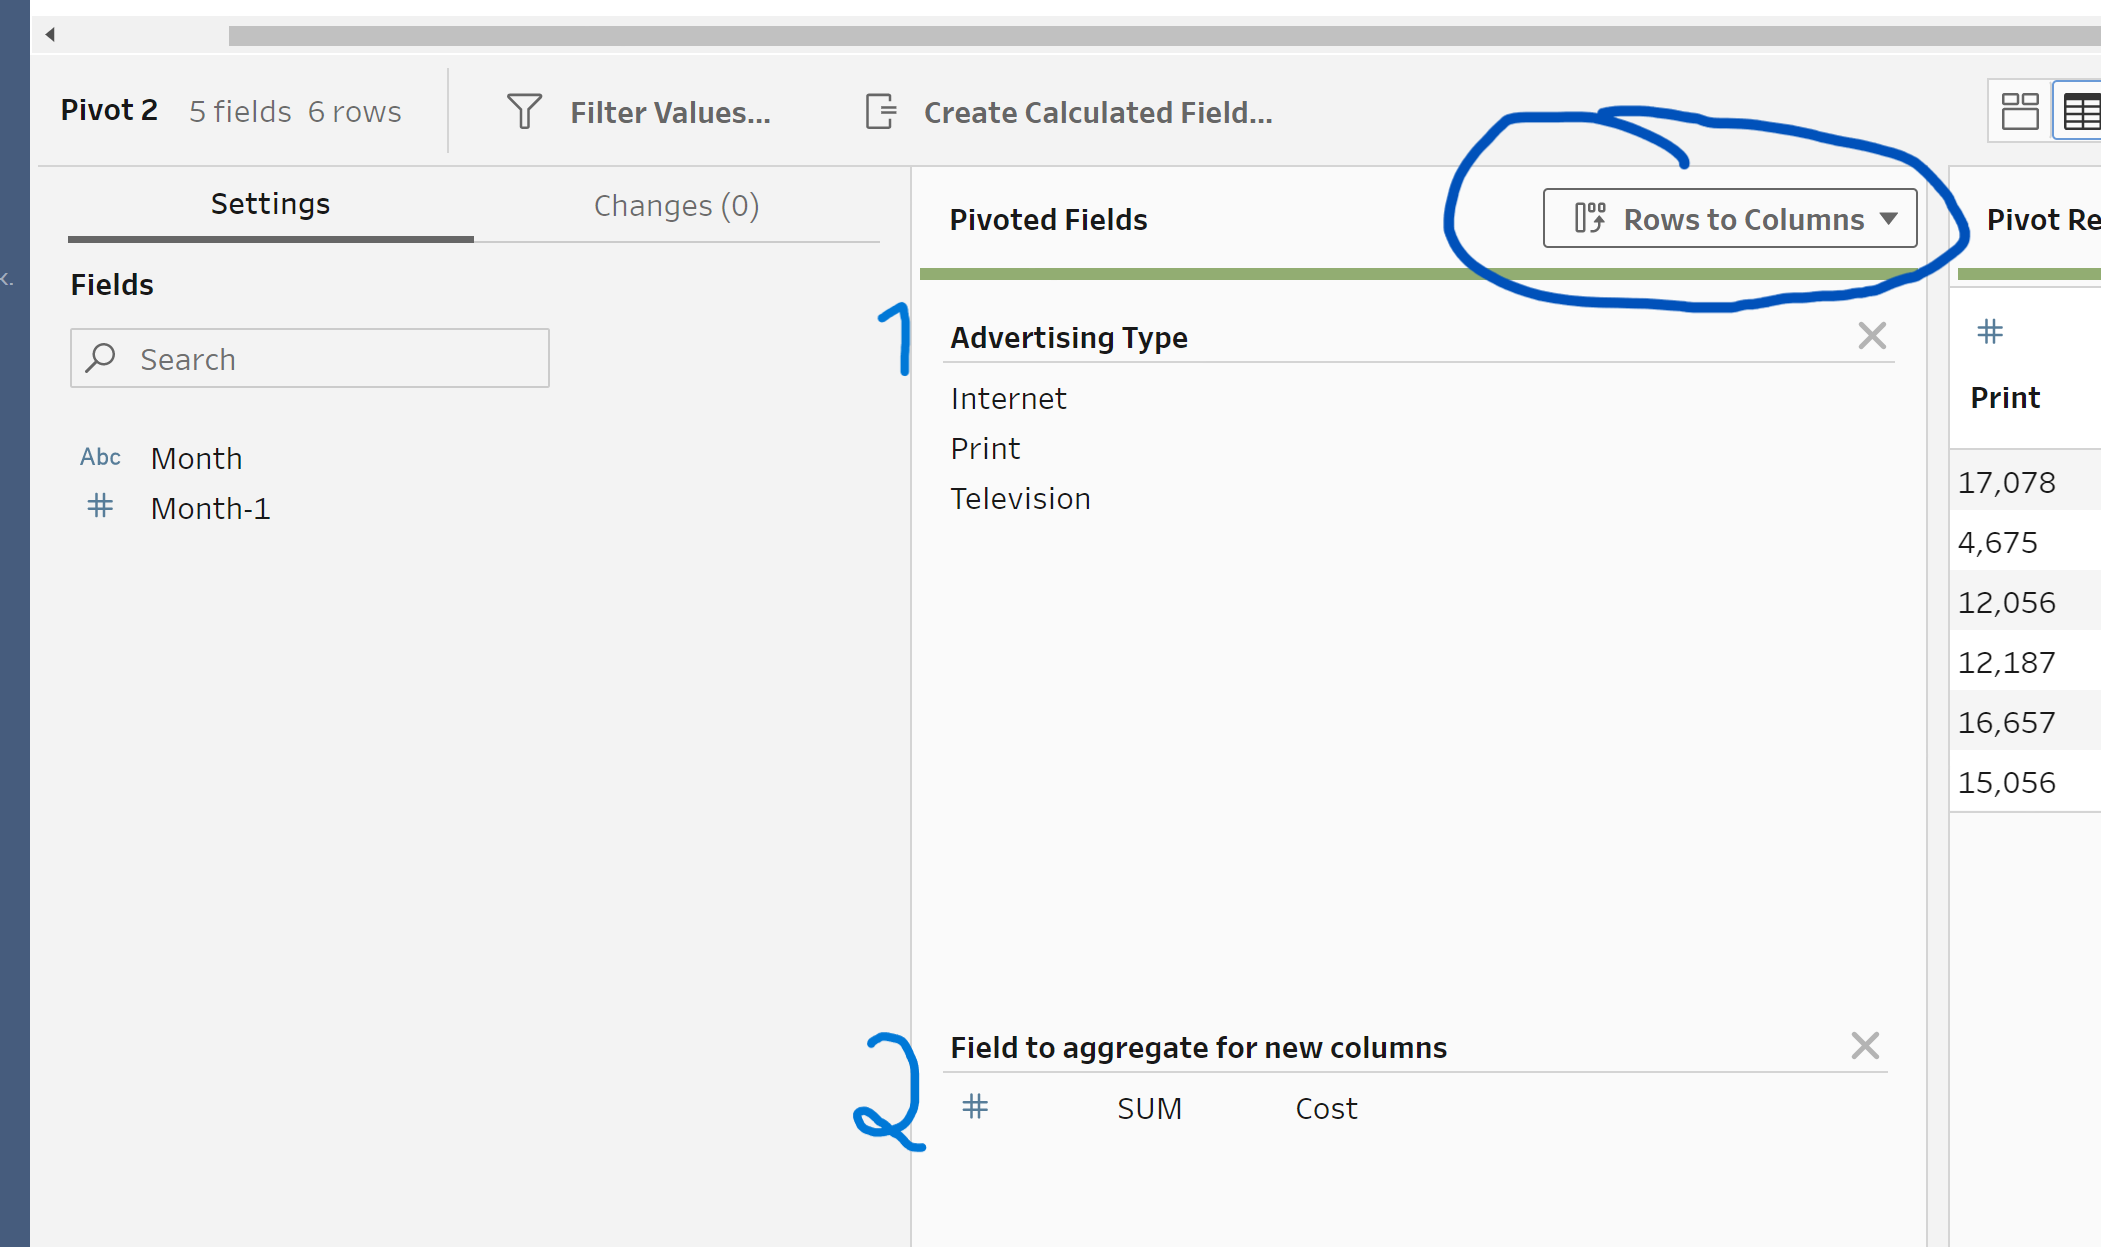
In the 1st field, You want to drag the "Advertising type" to the first field, because that is what you want to change from rows to columns. In the 2nd field, you want to drag the values, which is the budget spent for each "Advertising type".
The image below will be what you will get in return.
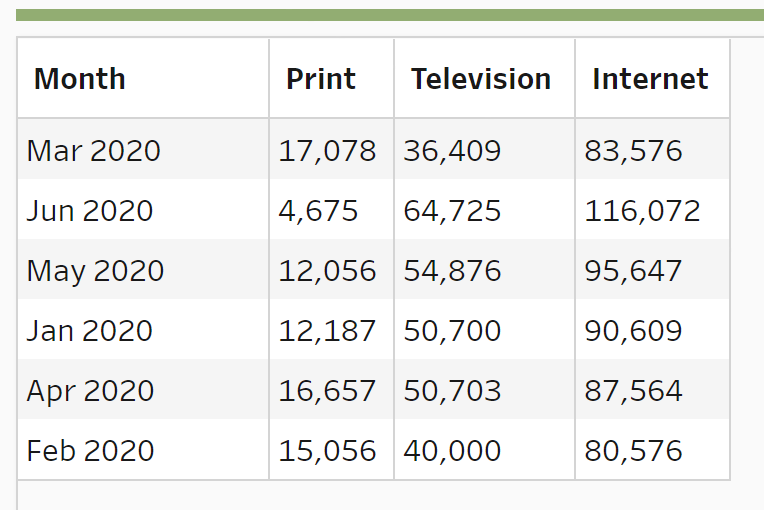
This way, the company will have a neat table that allows them to easily visualise how much of the budget is being spent each month for "Advertising Type".