During a client project one of our client projects, they asked us to create a dashboard that would be usable in mobile and on desktop. They gave us a few examples of app designs that they liked in which I found a constant pattern: All of them used rounded edge containers to frame the infographics.
I explored the different options to create this design layout and found out that a lot of my favorite vizzs were actually using an app called Figma for the design. In fact, I went through the viz of the day section and realized many of them were using it too and I had never noticed.
It felt like I had discovered a revolutionary secret so I am now goin to relay this finding on to you. I will be covering what it is, How its used and some of the examples I found on tableau public.
WHAT IS FIGMA?
Figma is a collaborative web application for interface design, with additional offline features enabled by desktop applications for macOS and Windows. In this case we will mostly use it to create dashboard backgrounds for the aesthetic design. You can also use Figma to create mobile layout designs, however, they will not work with tableau mobile as it will not scale properly making the background stack on top of your charts.
HOW IS IT USED?
They way to use it is that you basically design a background image on Figma that you will float all your graphs and containers on. It is better if instead of floating you use containers but this way you would have to build the dashboard first and then draw out the template over a screenshot of it.
You then set this image behind all of the other objects in your dashboard regardless of if you are using containers or floating everything.
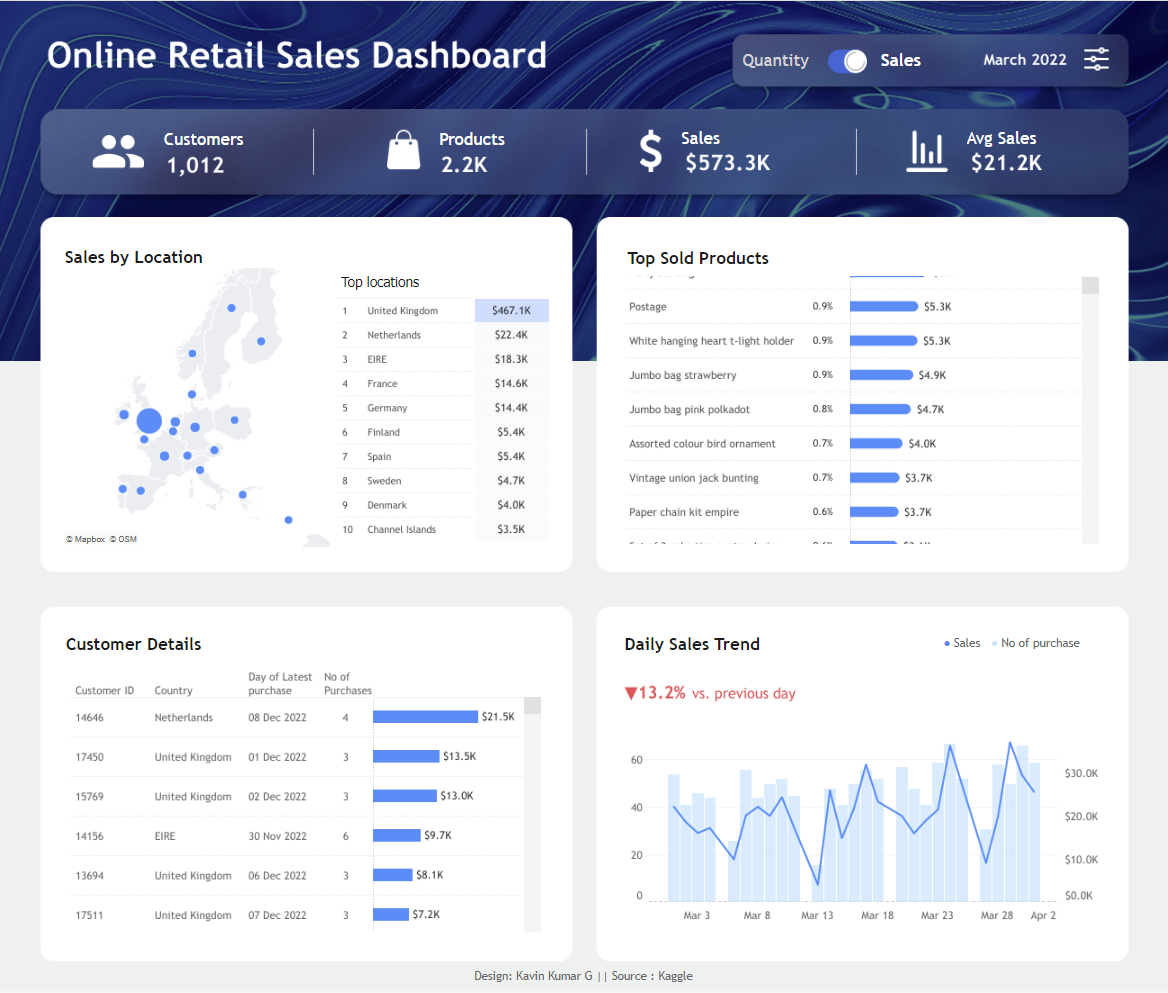
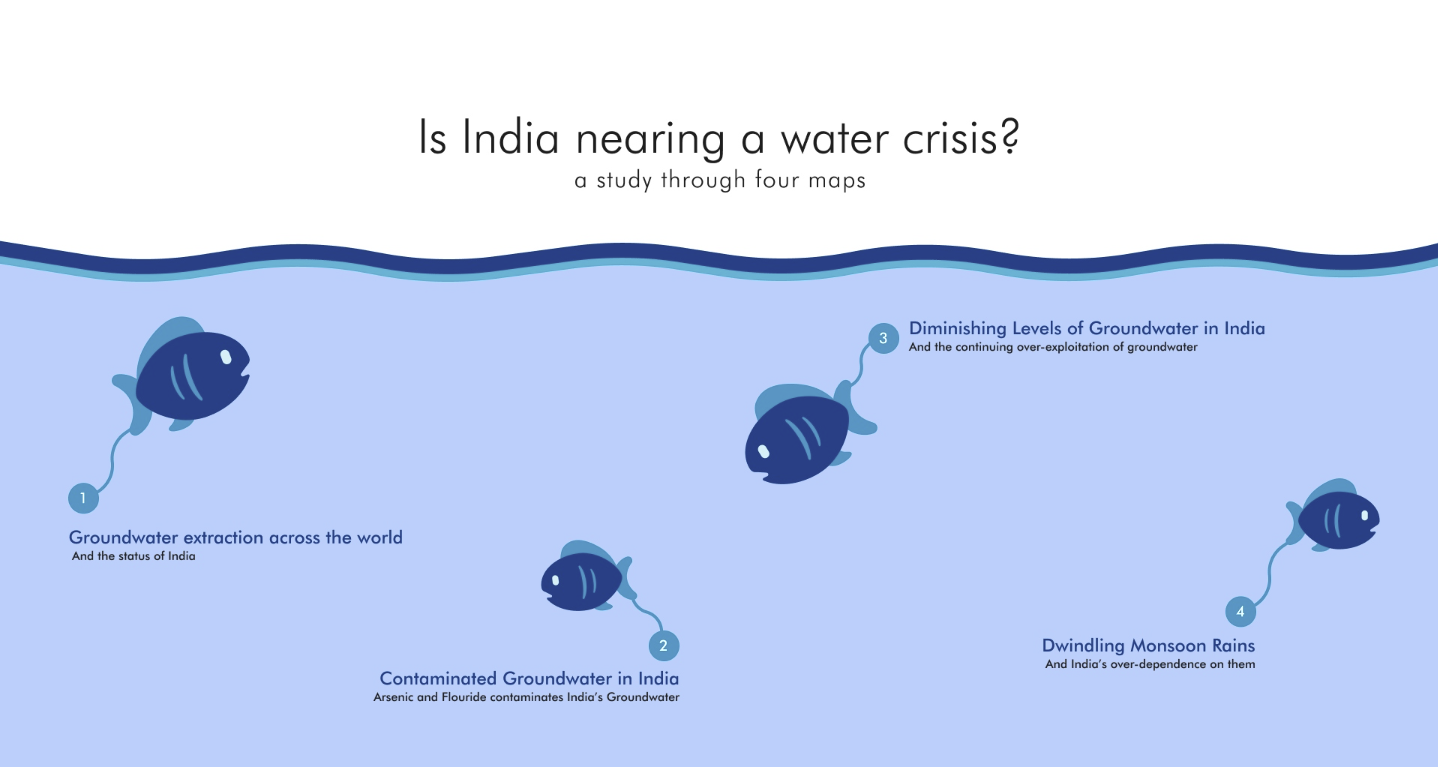
EXAMPLES: