Recently, I wrote a blog (https://www.thedataschool.co.uk/ellie-kershenbaum/small-multiples-chart-trellis/) in which I explained how to create a Trellis (or small multiples) chart in Tableau. In that post, I introduced two key table calculations required to build the layout. In this follow-up, I’ll focus on breaking down those calculations step by step, explaining why they work to correctly position each mark within a grid.
Rows
The calculation for the Rows field is INT((INDEX()-1)/ROUND(SQRT(SIZE()))).
The Denominator
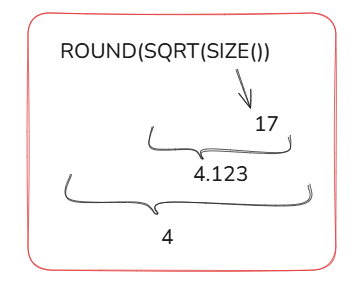
The denominator is ROUND(SQRT(SIZE())).
Working inside out, the SIZE() function in Tableau is a table calculation that returns the number of rows in the partition. In the example given, the partition is sub-category so SIZE() returns the number of sub-categories (which is 17).
With that example in mind, we can work through what the denominator returns:
The Numerator
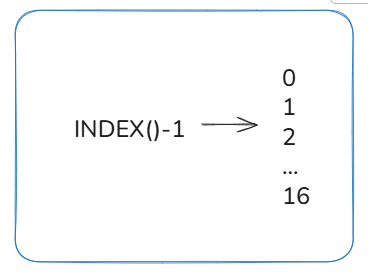
The numerator is INDEX()-1.
INDEX() is another table calculation which assigns a running sequence number to each mark in the view, starting at 1. So the numerator simply generates a sequence of numbers from 0 to 16.
So what happens when we divide the two?
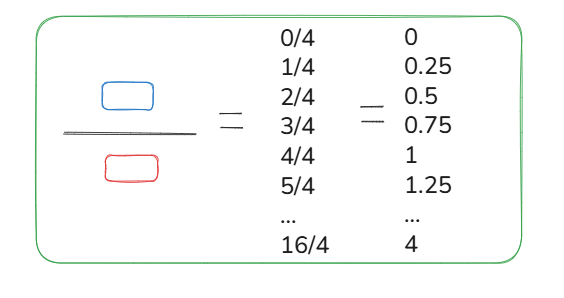
We get a sequence of numbers which, when wrapped in the INT() function, become -> 0000, 1111, 2222, 3333, 4.
Columns
The calculation for the Columns field is (INDEX()-1)%ROUND(SQRT(SIZE())).
Modulo
The symbol in the middle of our calculation (%) is a Modulo. Modulo is a mathematical operation that gives you the remainder after dividing one number by another.
The numerator and denominator are exactly the same as in the Rows calculation.
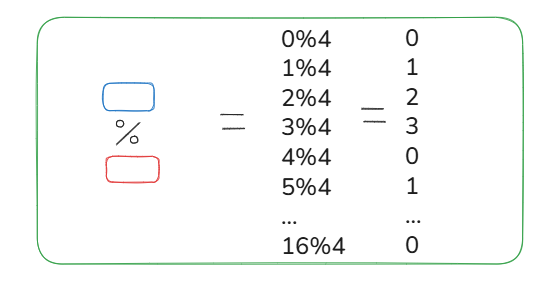
From this we get the sequence: 0123,0123,0123,0123,0.
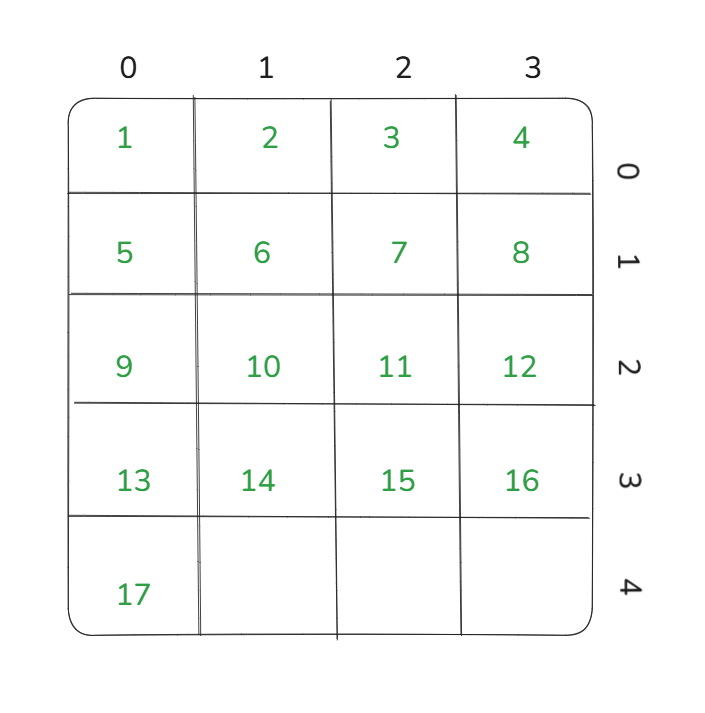
Using these sequences, each partition (or sub-category) is assigned a number for rows and columns. This ensures that every sub-category has its own grid space.