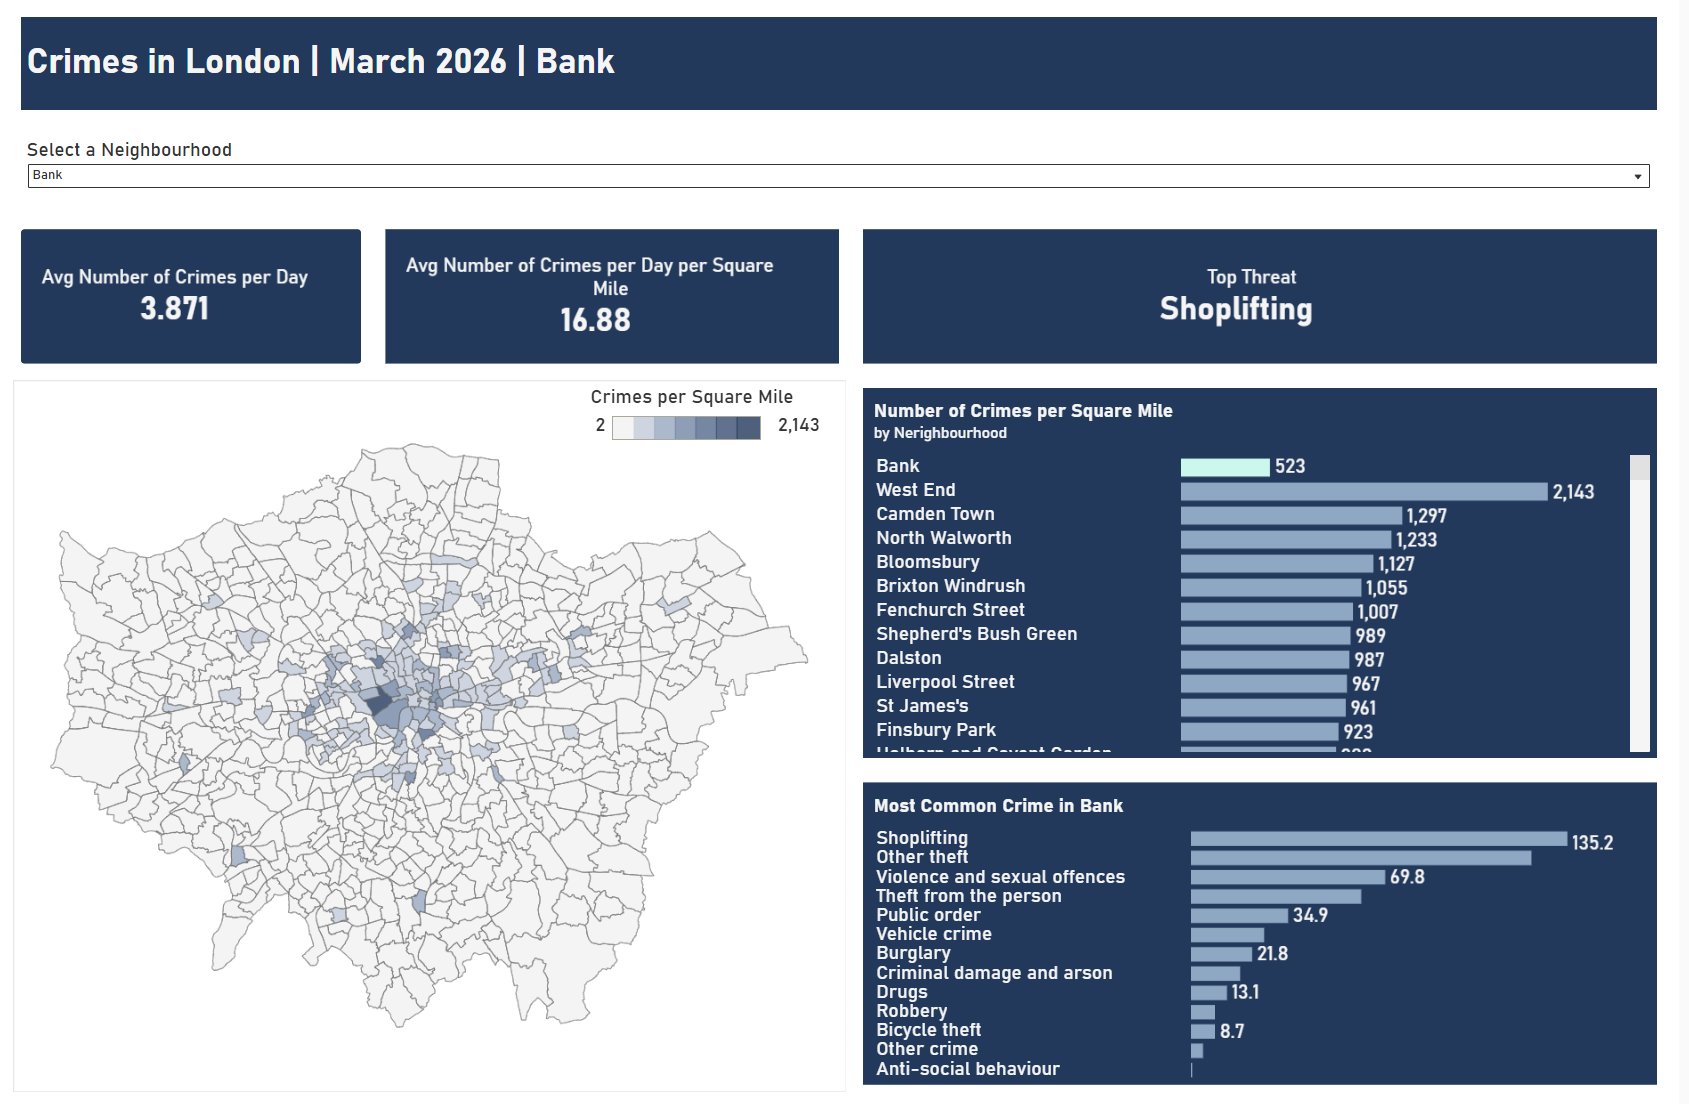
Brief
Today we had to use APIs, specifically the data.police APIs, in Alteryx to build a comprehensive spatial overview of UK crime in Tableau. We had to construct spatial boundaries by using Alteryx to transform raw coordinates into Polygon shapefiles for every police force neighbourhood. We then had create an additional dataset of all crimes at these locations for March 2026. Then in Tableau, we had to join the March 2026 crime point data with the neighbourhood boundaries to enable area-based analysis.
Data Preparation
The data preparation was the most challenging aspect of this project. I started by planning out which APIs would need to be used and looking at what would be returned. This was a useful starting point, and we were successful in retrieving the boundaries of the neighbourhoods and making polygons out of them, however we could not retrieve the crime data. This is because the urls to retrieve the crime data ended be up way too long because each polygon consistent of hundreds of latitude and longitude pairs.

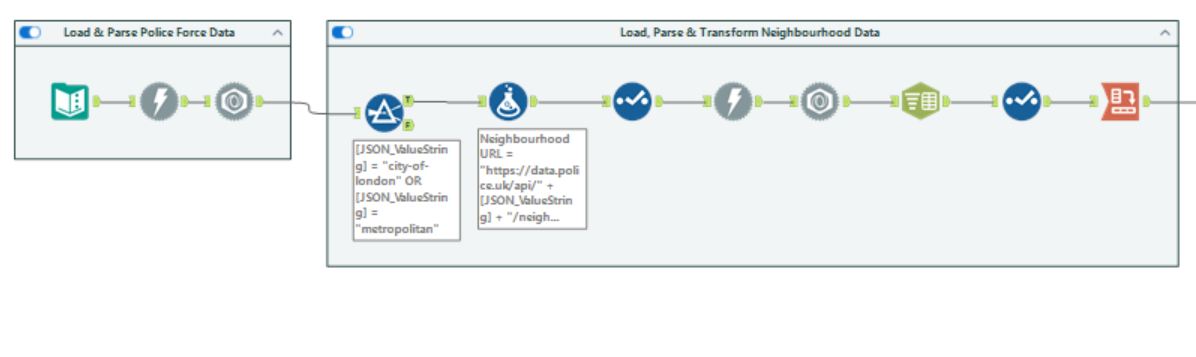
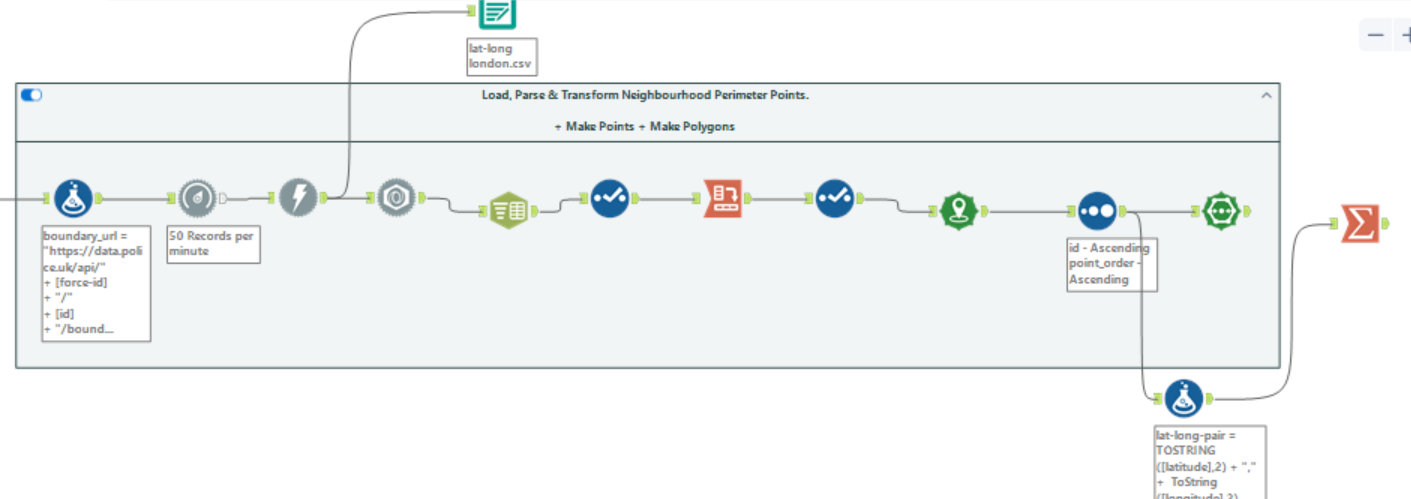
To overcome this issue, we ended up downloading the data straight from the website.
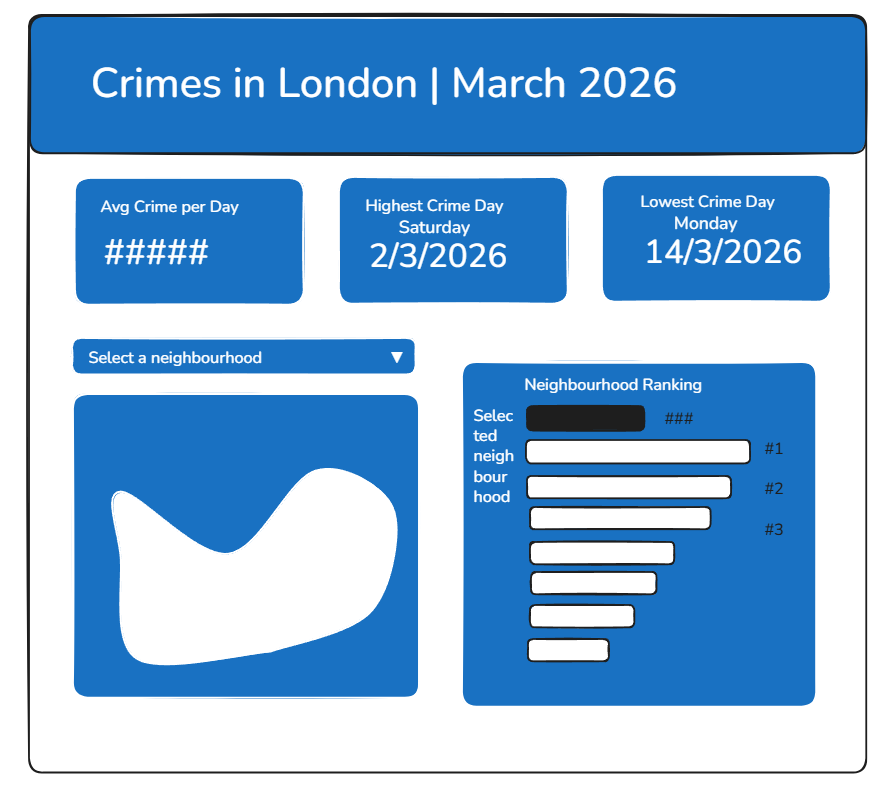
Sketch
Final Dashboard