


It is week 2 of The Data School, and this week we were introduced to Tableau Desktop! Tableau Desktop allows you to create instant interactive visualisations and put these together into a dashboard. But before we can do this, we need to connect Tableau to our data. Continue reading to find out how...
When you first open Tableau, you will be confronted with this view:
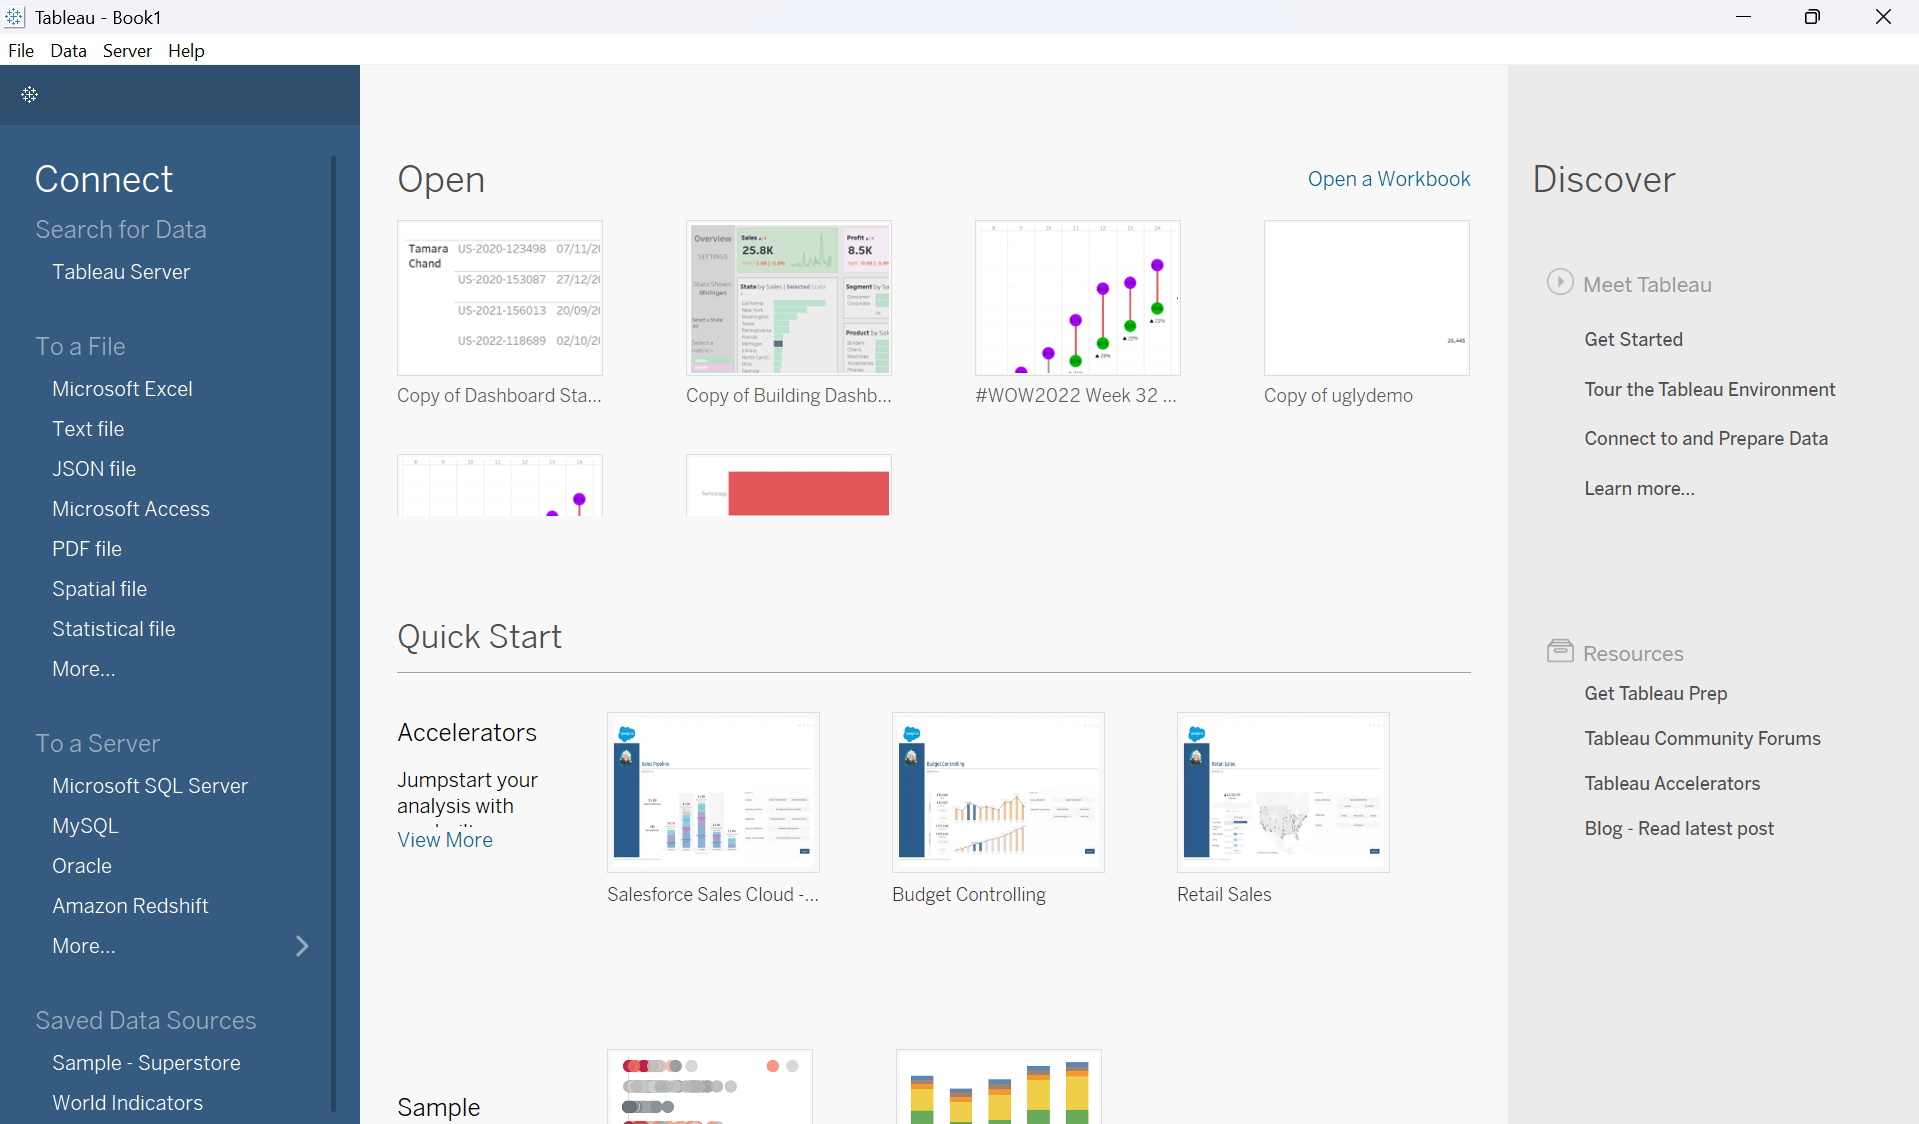
On the left is a selection of different ways we can connect to data. You can:
- Connect to a tableau server or another type of server
- Connect to a file - you can choose what type of file or if you’re not sure what type go to ‘More…’ and it will show you all types
Once you've connected to data, this has created a live connection to the data source; this means that each time you open the file tableau will reload the data.
However, if you want to share this workbook to tableau public you will need to make it an extract; this is where it makes a copy/snapshot of the data at that point in time and it will no longer be connected to the original data source (and thus will not refresh each time you load the workbook).
You can edit what is included in the extract - i.e., how many rows, so if you are working with a large dataset can use a smaller sample to experiment and create visualisations - this reduces rendering time.

Now you’ve connected to your data source, you will need to create a data model - how your sheets relate to each other. If you only have one sheet then just drag that one to the canvas and you're done. Otherwise:
- You drag your first sheet to the canvas
- Then add your second sheet and how they relate to each other - Tableau tends to be able to work out how sheets relate to each other and this will autofill but can also manually input.
- Repeat this step until you have related all the sheets you need to add.

You can also connect to two data sources that are unrelated.
- You do this by going to the cylinder at the top and clicking the arrow and selecting ‘add new data source’
- This means you could have a dashboard utilising both data sources - however, you wouldn't be able to use them both within a worksheet or create calculations with both of them.
Now you're ready to start visualising your data!