


For the third day of Dashboard Week, our challenge shifted toward spatial analysis and working with APIs.
The brief required us to extract data from the official UK Police API , construct spatial boundaries for police neighborhoods, and layer in crime data from March 2026 to create an interactive, story-driven dashboard in Tableau.
To make the project manageable within the tight timeframe, I initially chose to narrow my analysis to the Birmingham.
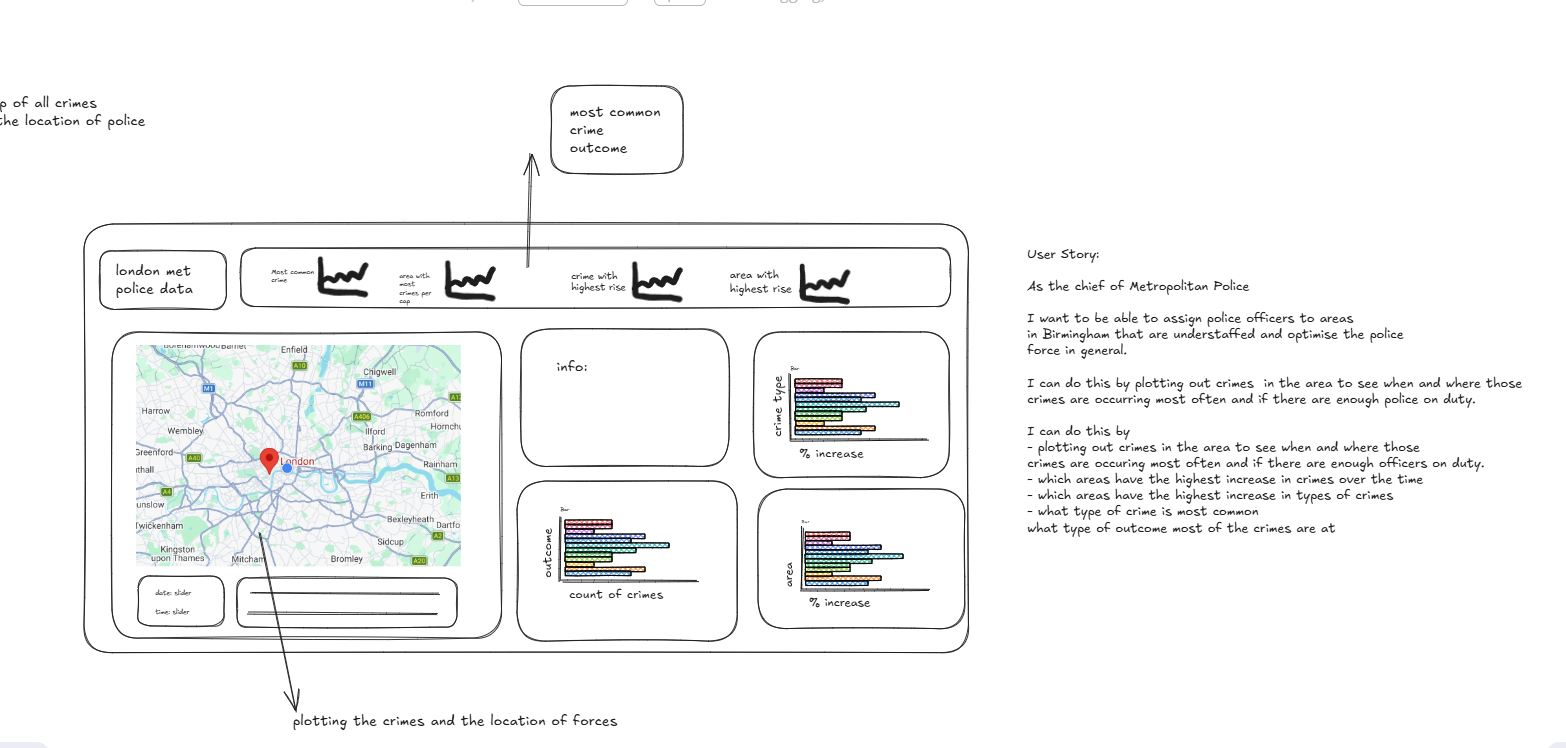
Planning and Sketching
Before diving into the data, I spent time scoping out the design.
The Alteryx Workflow: Navigating API Hurdles
The data preparation was the most challenging part of the day, requiring a sequence of four distinct API endpoints:
- UK Police Forces
- Neighborhoods
- Neighborhood Outlines (Boundaries)
- Crimes at a Location
Building the workflow in Alteryx immediately surface a few technical roadblocks:
- API Rate Limits: The API limits users to 15 requests per second. Alteryx doesn't natively handle sub-second throttling easily.
- The URL Length Bottleneck: The real breakdown occurred when trying to pull crime data using the neighborhood polygon coordinates. Because each polygon consisted of hundreds of latitude and longitude pairs, the resulting API URLs were massive, triggering errors.
The Pivot: To overcome the URL limit, I pivoted and downloaded the March 2026 street-level crime datasets directly from the website.
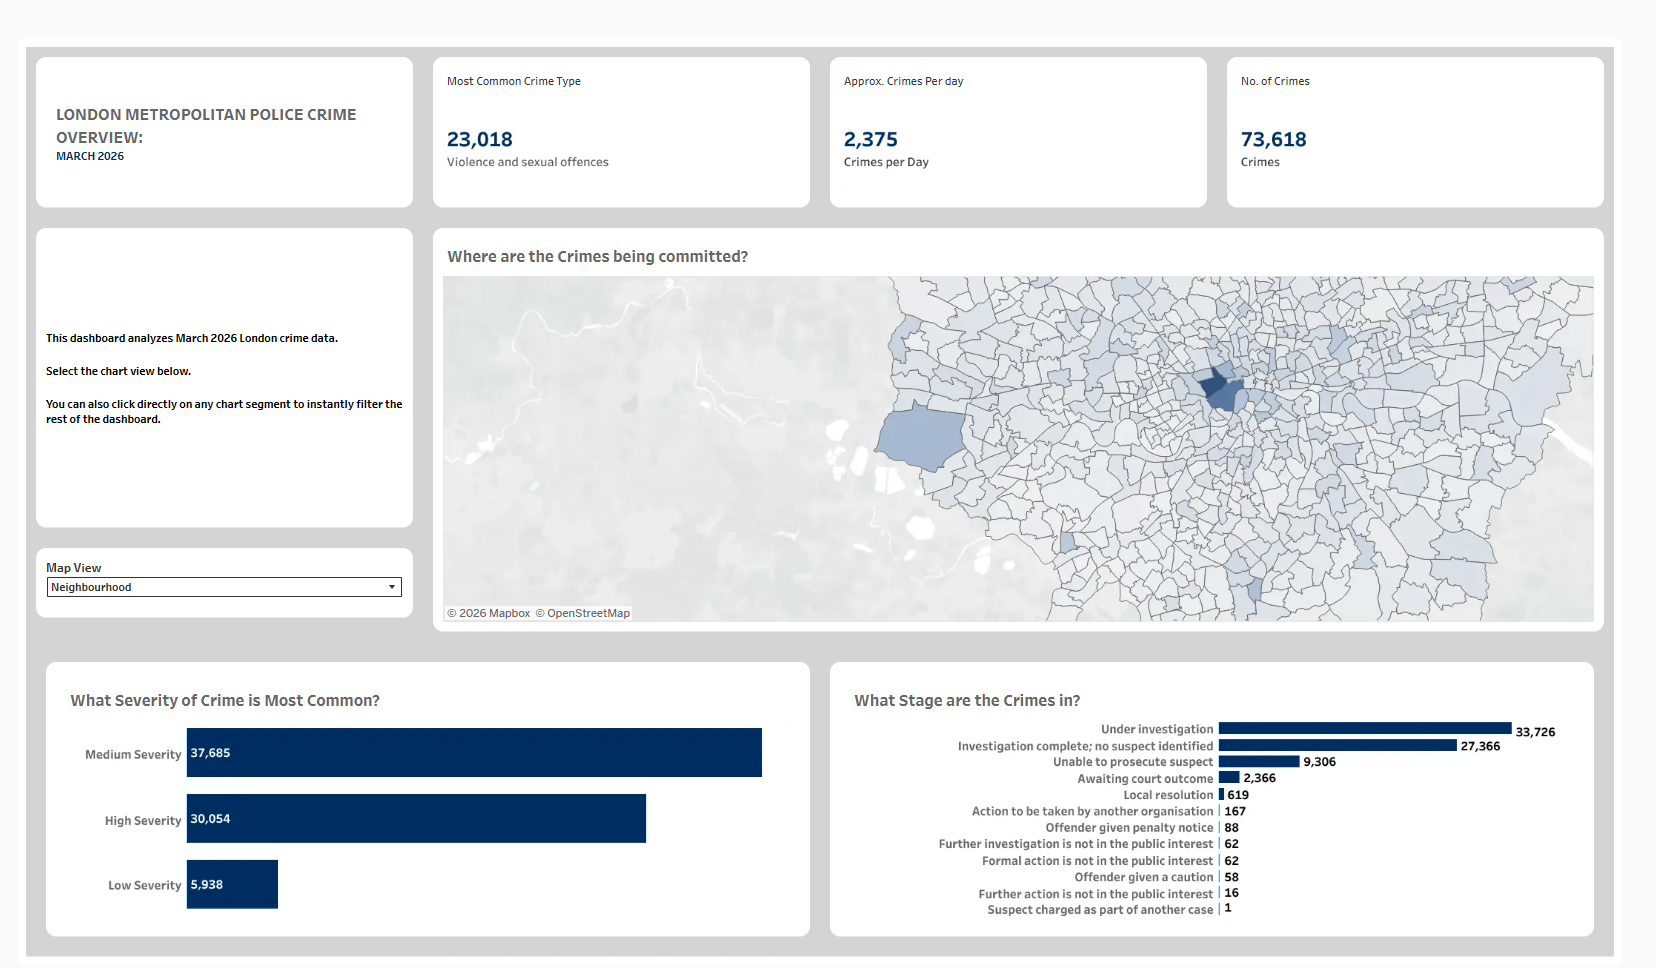
Another Pivot: My data would not download for Birmingham so I settled on City of London and Greater London and also the data only included the month information so this clashed with what I was able to do with my sketch.
Final Thoughts
The dashboard allows users to seamlessly search for their own neighborhood and filter by specific crime types. Selecting different categories dynamically shifts the density patterns on the map, revealing how dominant genres like fantasy or anti-social behavior shift geographically.
Despite the initial API rate limits and structural hurdles, a quick pivot in Alteryx ensured the final product was fast, responsive, and completed right on schedule. Now, it's time to take on the final day of training!