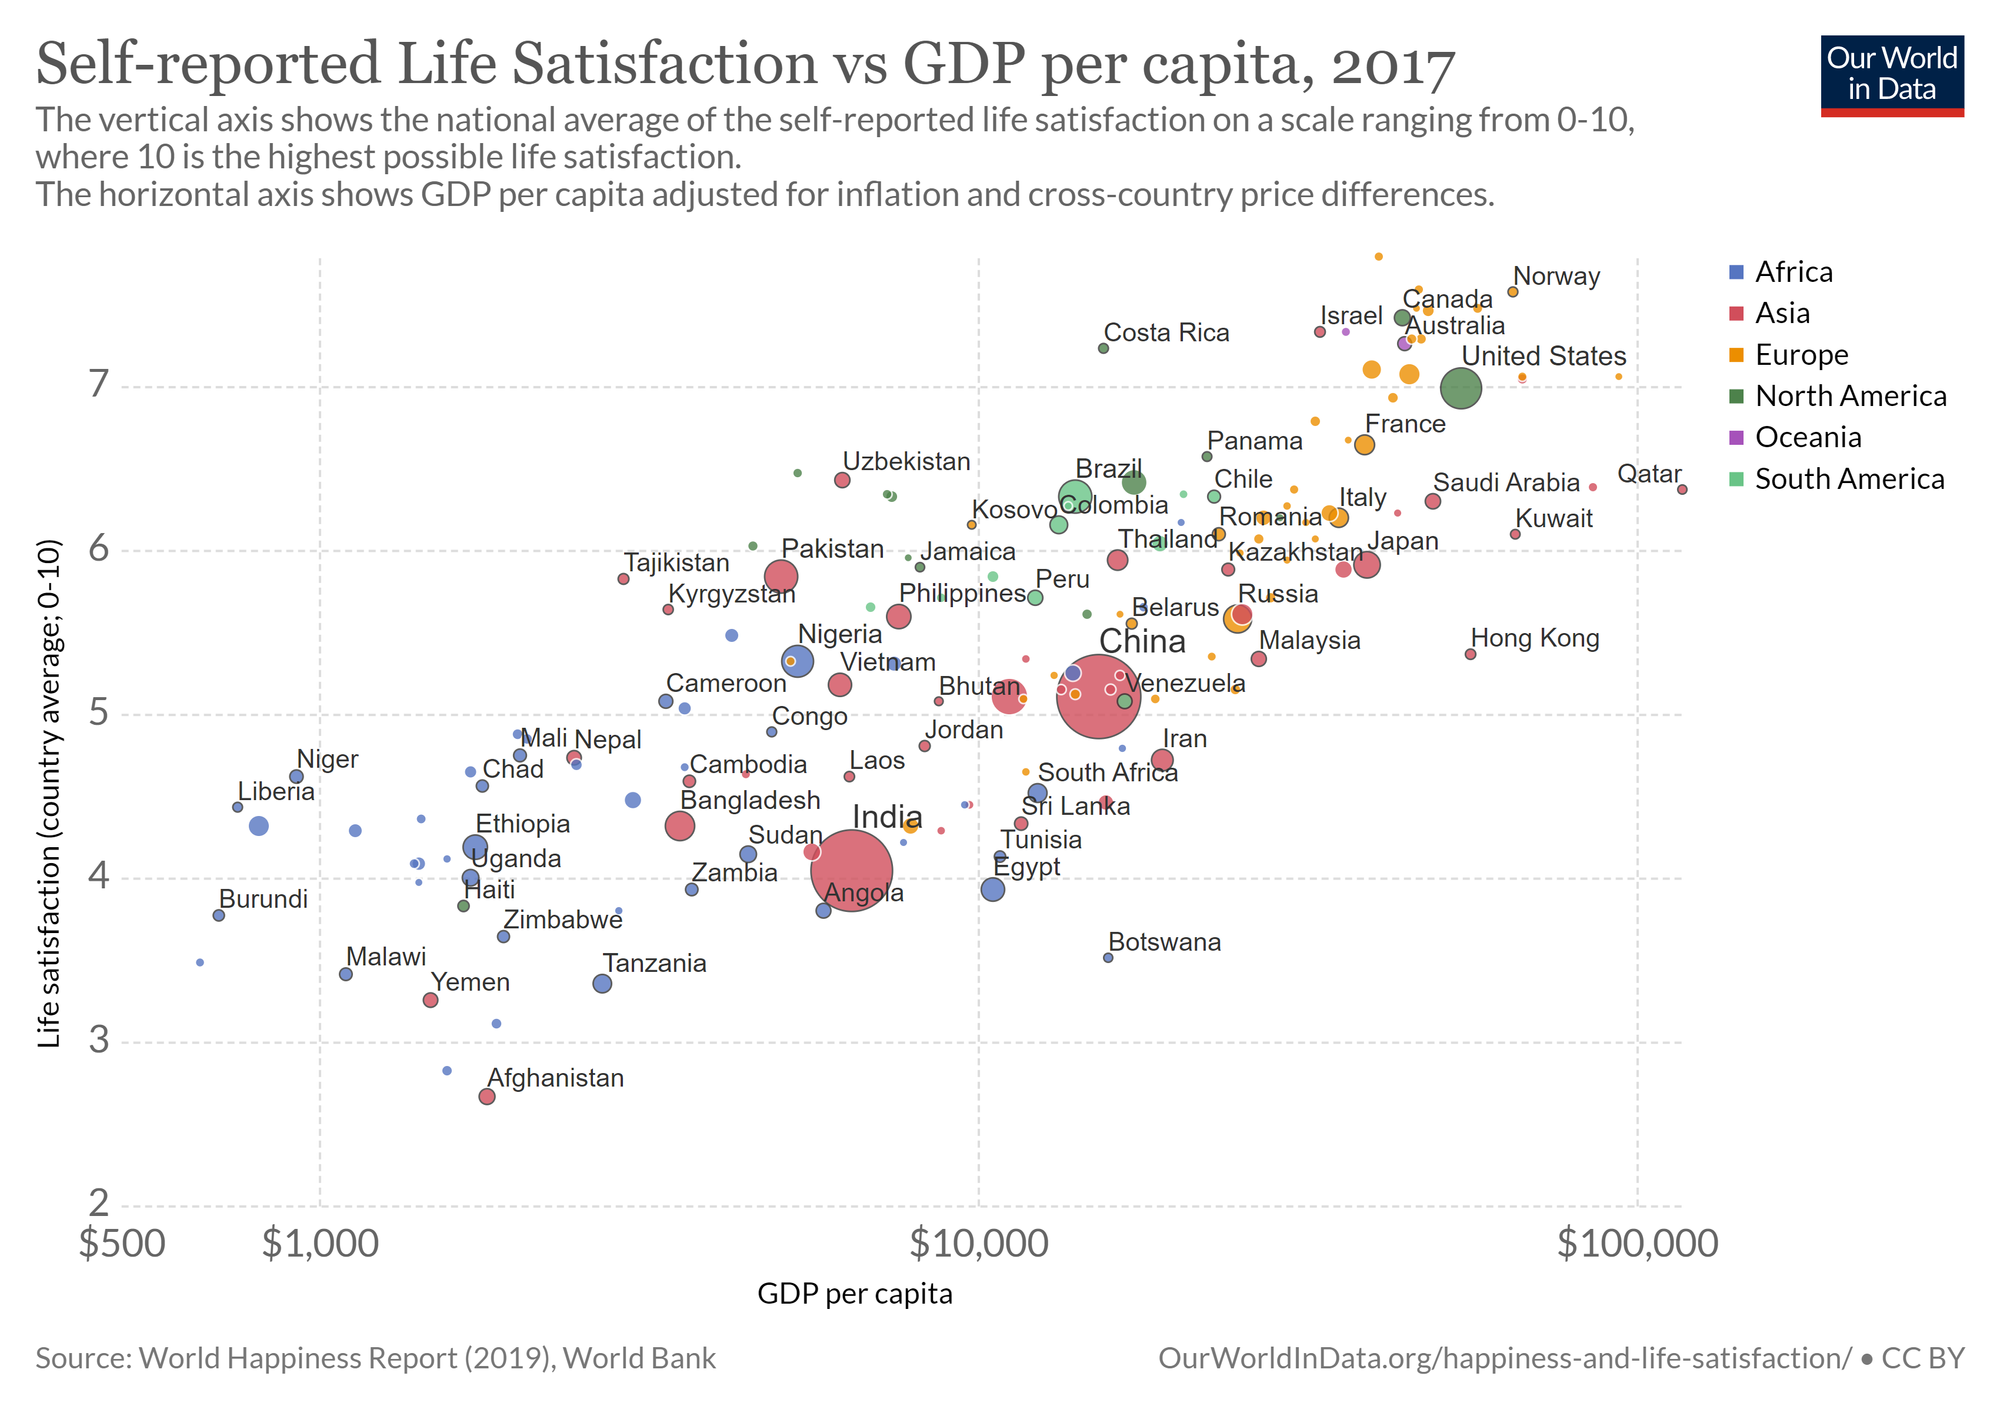
The weekly challenge this week involved taking a previous Viz created for a previous #makeovermonday, critique and then reproduce with improvements.
The dataset which I chose to replicate was based on the comparison between Life Satisfaction and GDP per capita, and demonstrating if there was any sort of correlation between the two.

I actually quite like this Viz, its concise and well presented for the most part, having the colours based on the region is a good way to identify any trends across the regions.
I felt the main issue with the viz was the overlapping of marks , this was due to the size of the marks being related to the population size so countries such as India and China will overlap multiple marks nearby.

This is my Viz using the same data set, its largely similar to the original but with some slight tweaks to the data I chose to represent. Rather than using all of the countries in the dataset, I instead chose to show the top 10 countries in each region in an attempt to declutter the chart whilst also providing some insight into how the regions compare to one another.
Another subtle change which I have made was to use the abbreviation of the country name as opposed to the entire country name. Despite helping clear up the chart a bit more, some of the abbreviations are not obvious to interpret.
I have also chosen to highlight two areas of the chart to help identify the best and worst performing countries based on the average for both Life Satisfaction and GDP per Capita.
If I was to continue working on my viz I would look for a way to incorporate the changes over time and look for the trends over the years.


