We were recently introduced to Alteryx as part of our training, and I’m already seeing why it’s such a staple for data preparation and analysis. To practice the basics, I took on Weekly Challenge #444, which uses the World Happiness Report Data for 2023 and 2024. This challenge can be solved entirely using the Favorites tab. Since it focuses on the most essential tools, it’s a great way to build foundational skills. I recommend giving it a go yourself first, then coming back here to compare solutions!
Which year had the highest average happiness score?
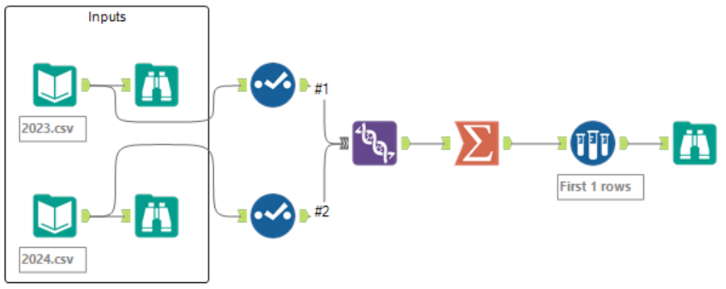
The first step would be to have a closer look at each of the datatypes in each dataset, to make sure they’re correct – this can be done using the select tool.
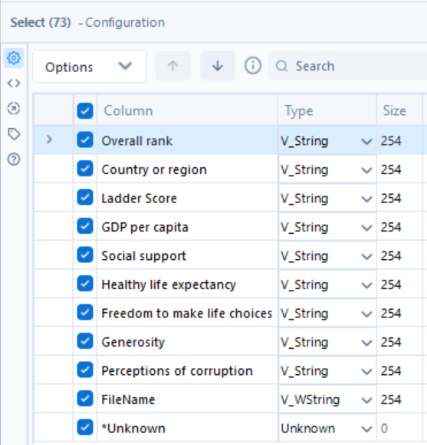
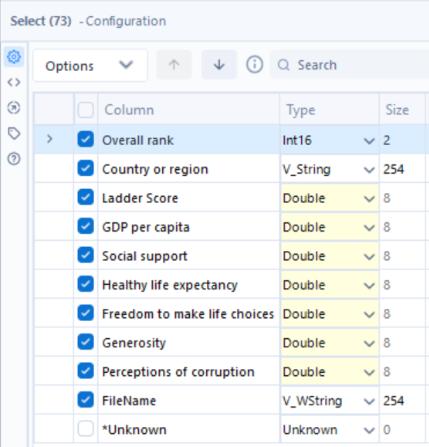
Using this on the 2023 dataset, we can spot many mistakes. From a quick look at the data, we see that ‘Overall rank’ contains whole numbers and the ‘Ladder Score’ alongside the six variables following it are decimals, however currently they are all classed as strings. Let’s change this, for ‘Overall rank’ select Int16, and for Ladder Score and the six remaining variables select Double. Lastly, untick the ‘*Unknown’ column, as this is not needed here.
The same steps can be repeated on the 2024 dataset.
As we want to compare happiness scores across both years, the next step would be to use the union tool to combine the datasets. As both datasets have the same names for column headers, this should be very straightforward.
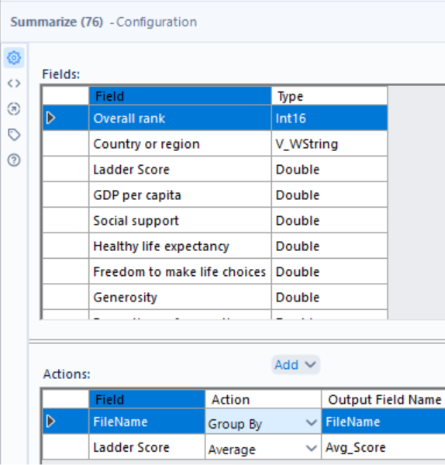
As we want the average happiness score for each year, the summarize tool is used to aggregate the data – grouping by ‘FileName’ and calculating the average ‘Ladder Score’.
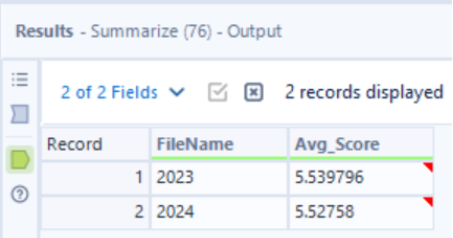
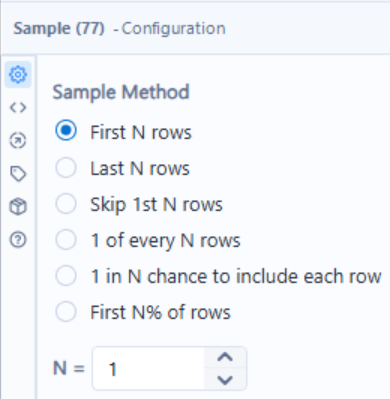
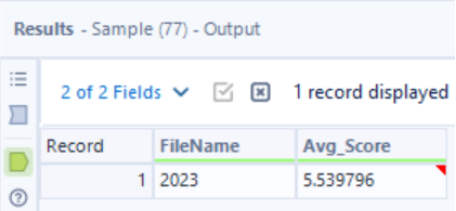
From the outputs, we can see that 2023 has the higher average happiness score, so the sample tool can be used to keep the first N rows where N = 1.
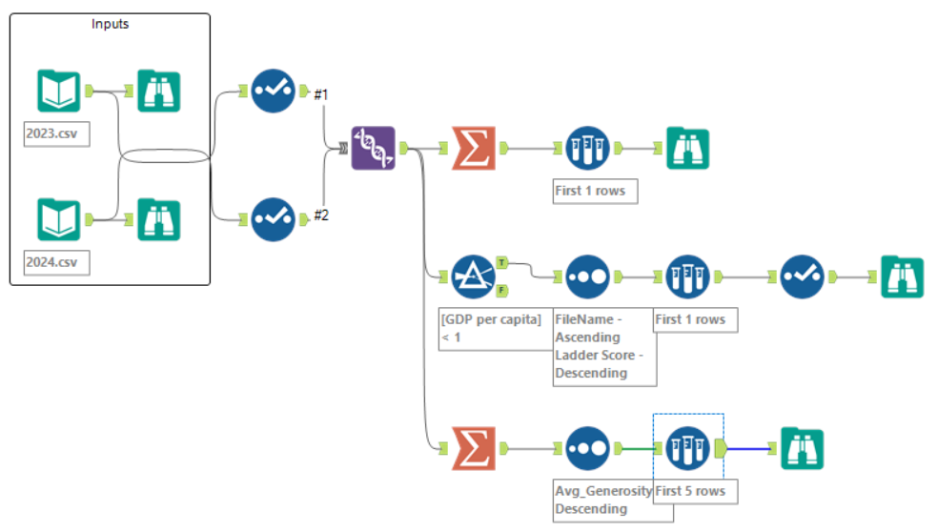
Your flow should look like this:
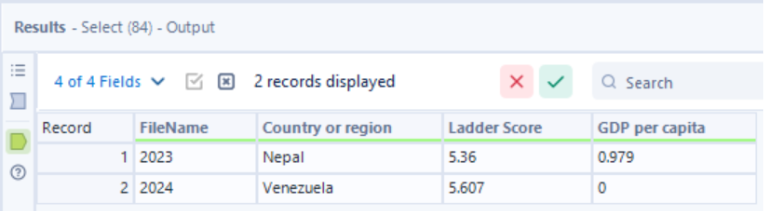
For each year, which is the highest-scoring country with a gross domestic product (GDP) under 1?
Using the output of the union from the previous question as our input here, the filter tool can be used to only include records where the ‘GDP per capita’ column is less than 1.

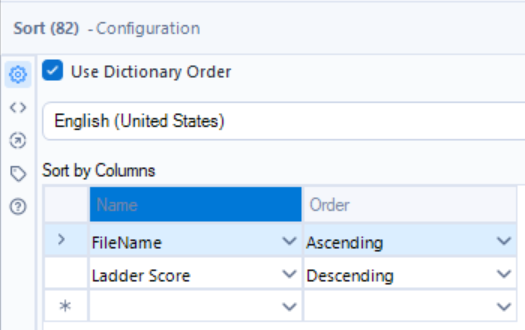
This is followed by the sort tool, where for each year we want to sort the records by their Ladder Score value, from highest to lowest. So, ‘Filename’ will be sorted with ascending order first (for ‘Filename’ it doesn’t matter whether the sort order is ascending/descending), then ‘Ladder Score’ will be sorted in descending order.
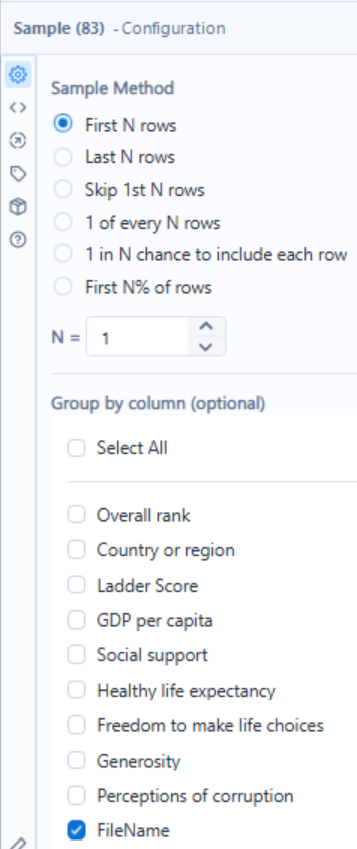
Now we only want to keep the first record that appears for each year, because this will be the country with the highest ladder score, given their GDP per capita value is under 1, for each year. This can be done using the sample tool again, keeping the first row grouped by FileName.
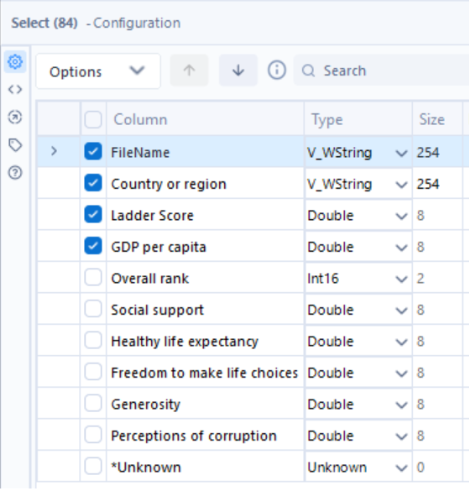
Lastly, the select tool is used once again to only keep the necessary columns.
Your flow should now look like this:
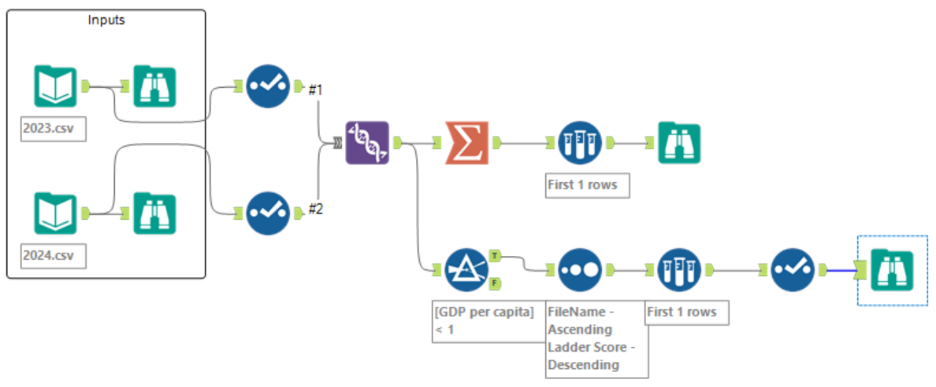
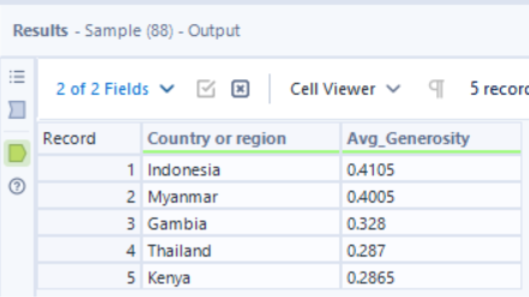
Which five countries had the highest average generosity factor over the 2-year period?
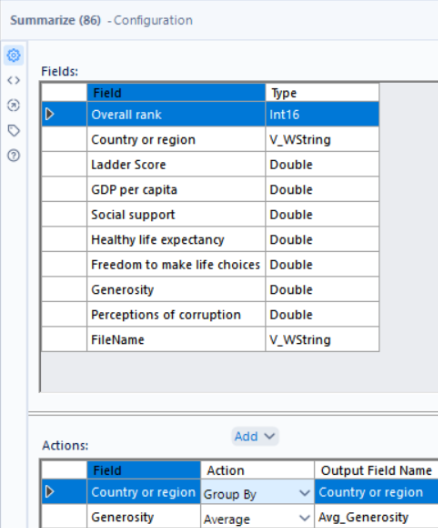
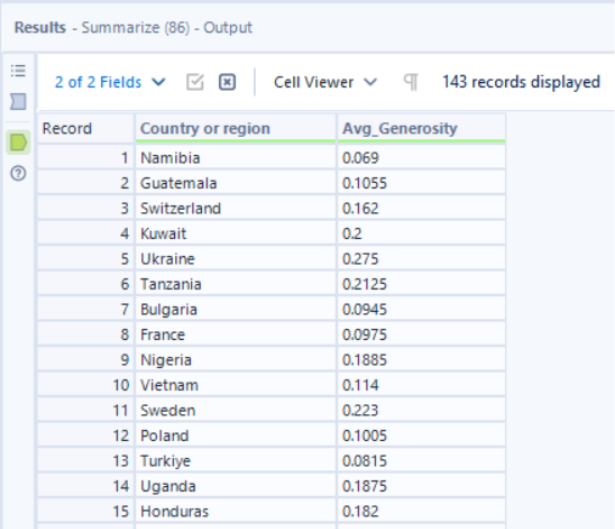
Again, using the output of the union as our input here, the summarize tool can be used to aggregate the data and calculate the average generosity fact over the 2-year period for each country.
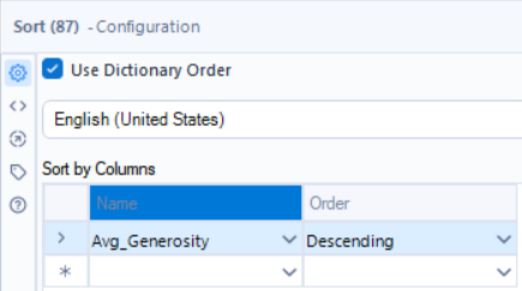
To then sort the records by their average generosity factor, from highest to lowest, the sort tool can be used where the order for ‘Avg_Generosity’ is set to descending.
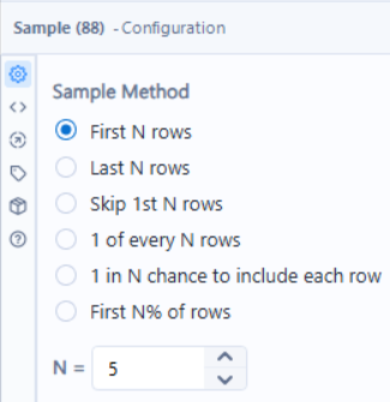
Lastly, as we only want to keep the top 5 countries with the highest average generosity factor over the 2-year period, the sample tool is used to keep the first N rows where N = 5.
After answering all 3 questions, your final flow should look like this: