


Project Management
As the last person in DS53 to have their turn as project manager, I had plenty of time to reflect on previous weeks and plan for my own week, incorporating parts from other weeks that had lead to successful projects.
As the project involved heavy use of Alteryx, which we had not had the opportunity to use in a client project so far, I knew that doing extensive planning beforehand would be important. I made sure to reach out to our coach and gain an understanding of the stakeholder, and what the aim of the project would be. After reaching out to those familiar with API's in the office and creating a plan for the week ahead, it set us up well to hit the ground running on Monday.
The week was a smooth operation overall. I had a strict plan that I wanted to maintain, and thanks to the team's hard work we were able to stay on track. Come Friday afternoon and the end of the presentation, we had provided the client with all of the deliverables requested of us, and then some. The experience of leading a team in the workplace is something new to me, and I am glad for the opportunity to work with those I have been in training with for 3 months and successfully deliver the project.
If you would like to read more about my experience, as well as some tips for leading your own client project, read my blog here.
Tableau Server
We had the opportunity to learn more about the background operations that goes behind Server. With the help of Coach Robbin, we created our own personal servers that we can host our own content on. Through AWS, we were able to obtain a virtual desktop for each of us to use and practice accessing our server, and uploading data to it. To do this, we used Tableau Bridge. This is a client software that connects Cloud to on-premises or private network data sources. It acts as a proxy to enable live queries and scheduled extract refreshes for data that Tableau Cloud cannot reach directly.
Once we had generated some fictitious targets for each superstore category, we were able to create a simple chart in Desktop that accessed both Sample Superstore and the data from the virtual machine. Once uploaded on to our personal site, we could then update values and have it reflect on the server. I find myself enjoying the server related sessions interesting each time we have them (potentially more than the visualisation software, but don't tell anyone that).
Tableau Postgres
This is a PostgreSQL database that servers as the Tableau Server repository. This stores and manages the metadata of Tableau workbooks, data sources and other assets created and shared on a server. Postgres is an open-source relational database management system that is used to maintain large data sets. It organises data into tables with each table consisting of rows and columns. You are able to access data directly from Tableau Desktop and create visualisations with a live connection.
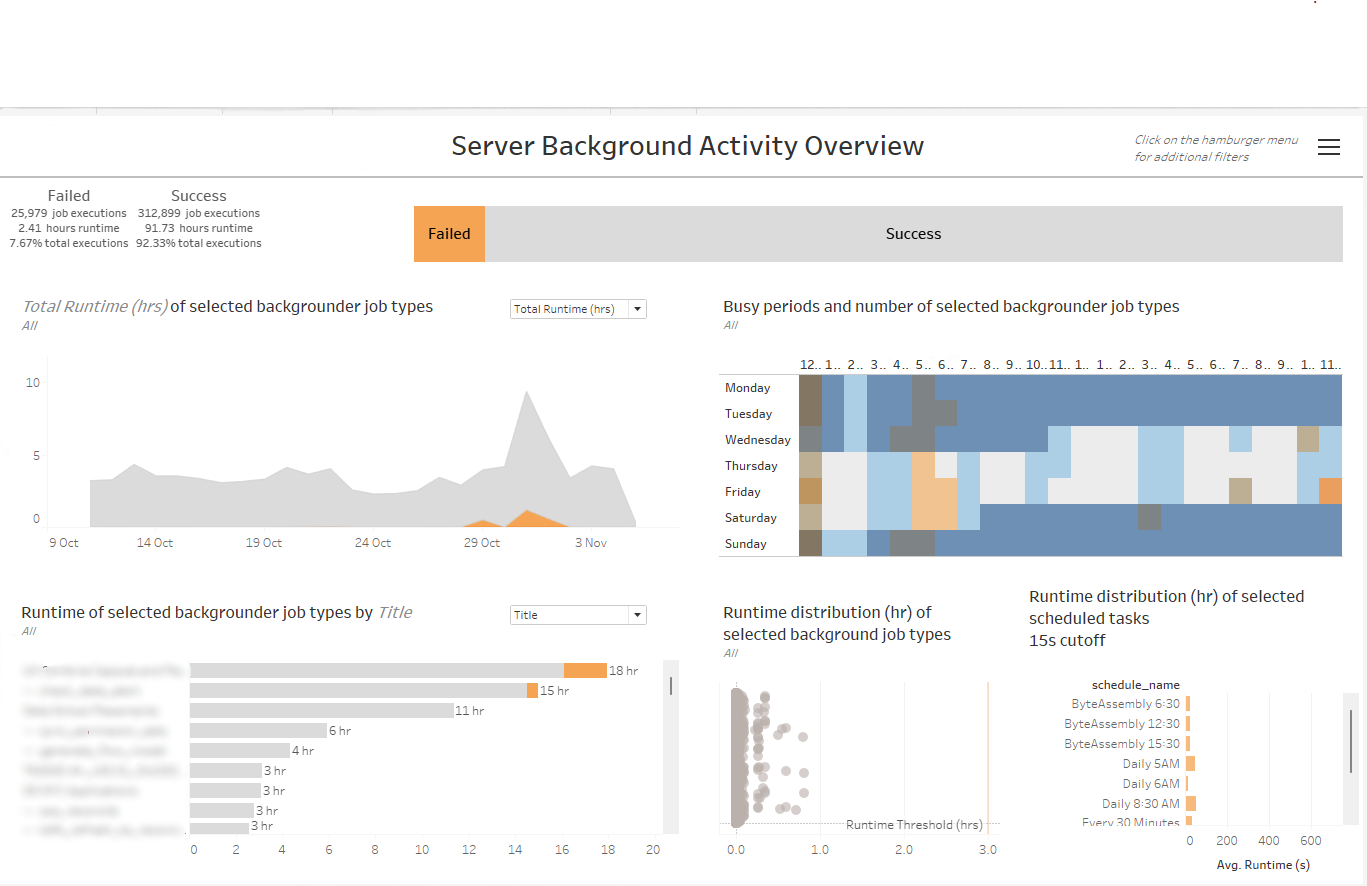
The repository holds information relating to user statistics, about what people are clicking on and where, which dashboard is accessed, how often, and by who. If you navigate on Tableau Server to all sites, then to the Server Status tab, you can scroll to see some of the Tableau native metric dashboards. I used the the background tasks dashboard as inspiration to adjust some of the metrics and include a runtime distribution chart for schedules tasks.
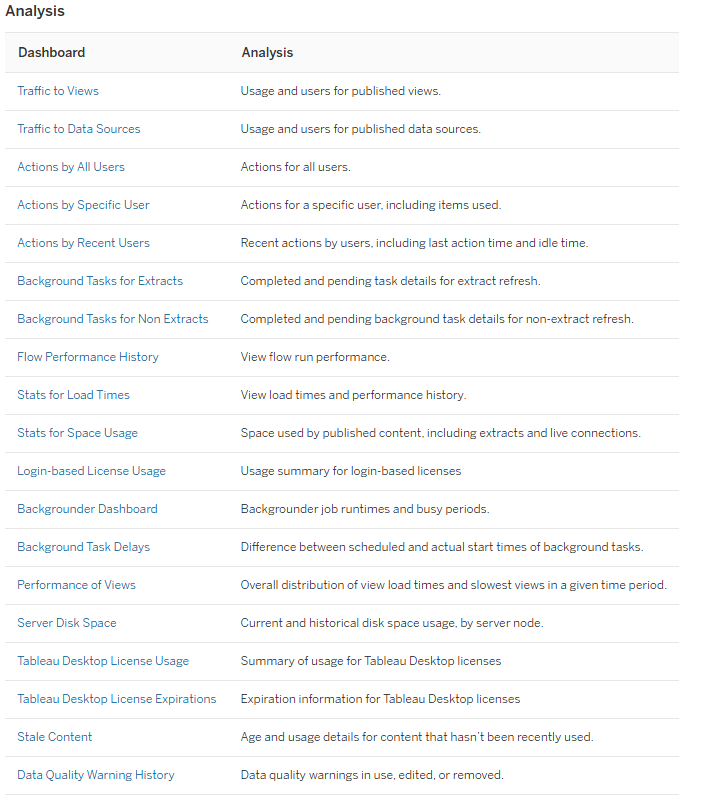
I used the the background tasks dashboard as inspiration to adjust some of the metrics and include a runtime distribution chart for schedules tasks.
Next Week...
Our last weekly Client Project, and my Tableau Certification exam are taking place. This feels like the last push before refreshing on certain topics and Dashboard week begins.