Cross tab and transpose are extremely powerful tools in Alteryx for managing and organising our data. Whilst both have their own use cases they are easily confused with one another and can be somewhat difficult to distinguish at first.
Transpose
Transpose is arguably the easiest of the two to grasp. In essence, it changes our data from a wide data set to a long one, by switching our columns into rows. This is great if we need to summarise or aggregate our data as this cannot be done with wide data sets.
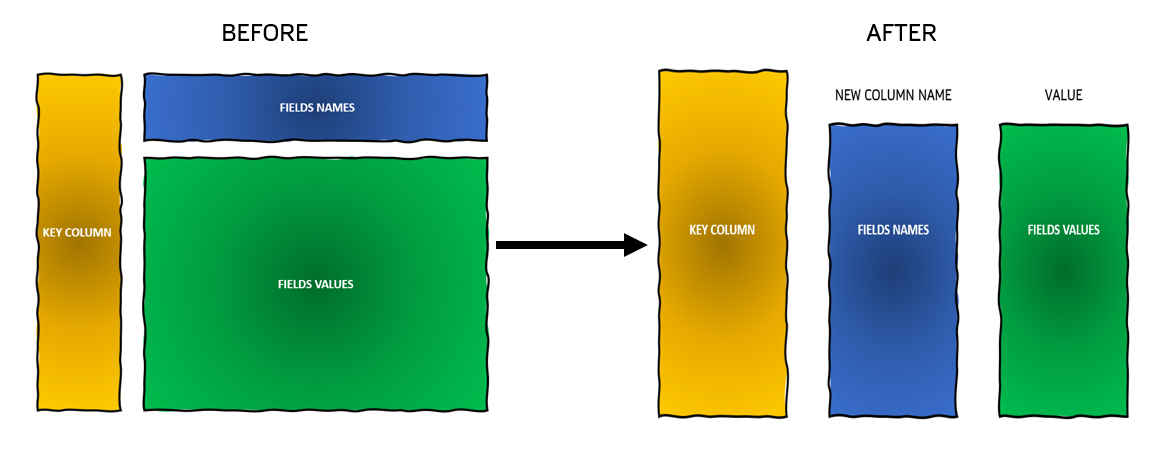
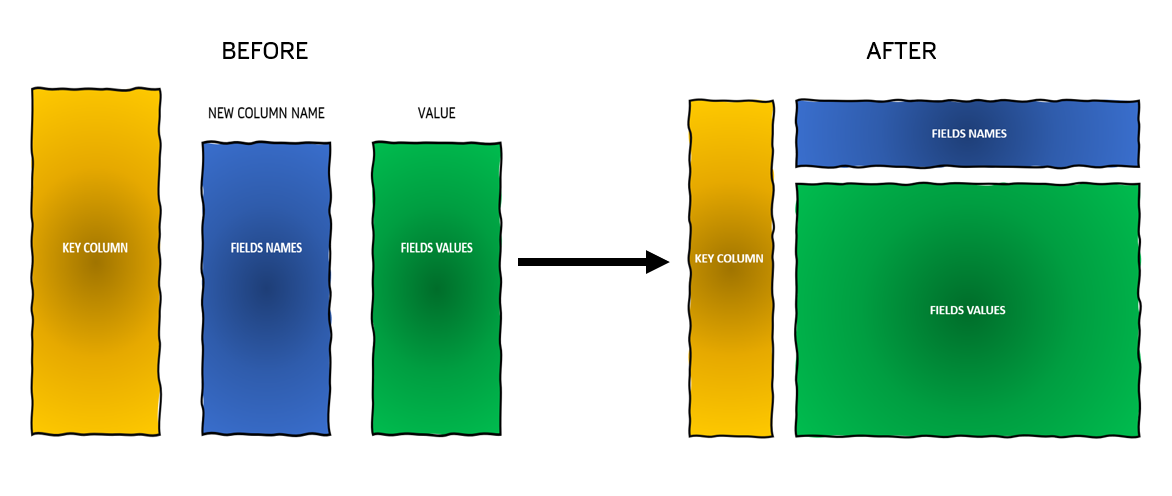
As we can see, the transpose tool will pivot our data around a "key column". It allows us to combine columns (blue, field names) into two. One column will contain the previous field names (column names) and the other will contain the field values that belonged to those columns (green). This makes our data set thinner and longer as all those field values now belong to a single column.
Let's see how this is done and what it looks like in practice.
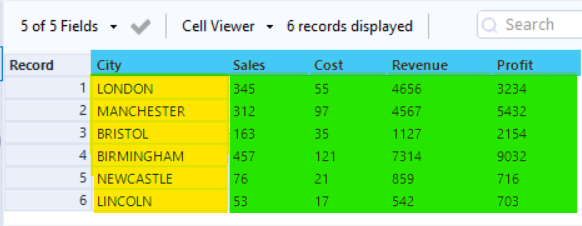
Let's take this data set as an example and see what happens when we apply the transpose tool. The data set is not colour coded in Alteryx but for demonstration purposes, I have highlighted the area so they can be referenced to the images above.
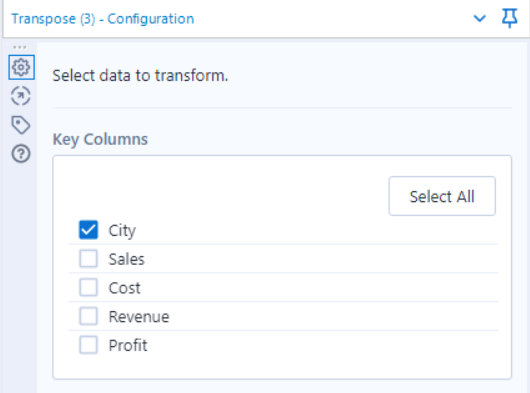
Our first move is to choose a "key column" this will be the column on which the rest of the data is going to be pivoted. As the pivot column, this column is going to remain static and won't be changed. For this example, we want to pivot around "city" as we can easily relate our data around each city. In general, you'll find yourself pivoting around customer IDs, locations, names and other strings. It's very rare and not advised to pivot around values as they can often belong to multiple other columns.
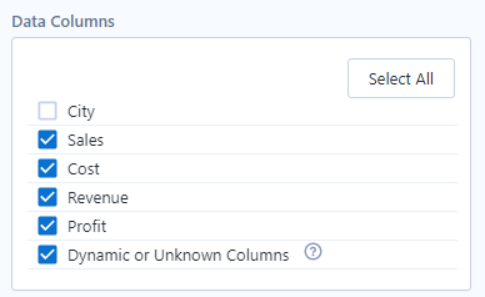
Next, we have to select the data columns. These are the values that are going to be flipped and transformed from multiple columns into a single "value" column. These are the green in above and usually value but not always, sometimes they can be subcategories of your main column or just any other column. Alteryx kindly unselects our key column as we should never include the pivoted column. The rest can all be ticked. If you no longer need a set of data you can uncheck the box but it will be removed from the data set.

This final box is just us telling Alteryx how to deal with missing columns. In most cases "warn" is the best option.
Then we can click run and view the results.
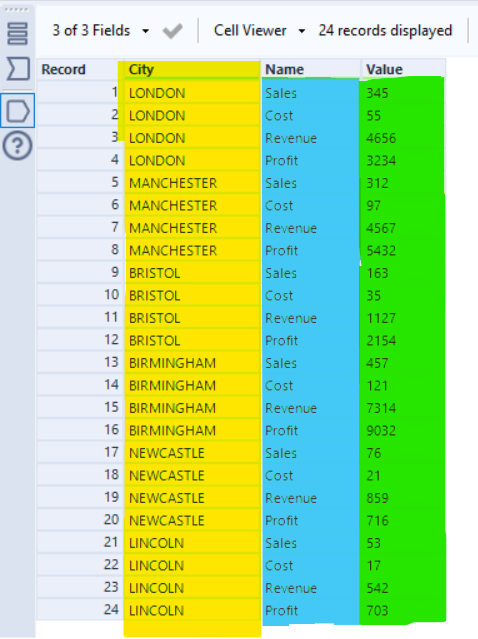
We can see how our data has been pivoted on the city column, we can see how each city has now been given a row for every measure and how they all have a corresponding value. Whilst this may be a little more complex for us to read it's actually a lot easier for Alteryx to process and run the action on.
Cross tab
Cross tab basically does the reverse of what the transpose tab did. Unlike transpose which changes all our columns into one, crosstab takes a single column in order to make more. Using our previous example we can work back and see how we can revert it back to the original format using the crosstab rule. Below we can see the changes it makes.
How to set up cross tab
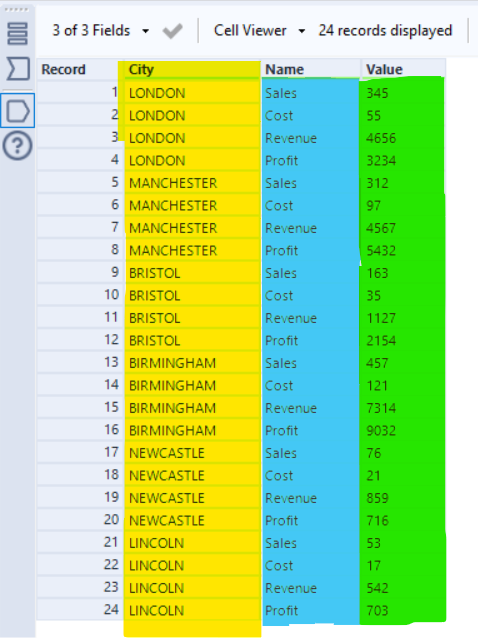
We start with how our data ended in our transpose section with all the cities in one column, all the measures in the middle and the values on the right. We want to split the measures (blue) back into column headers and assign the values to them.
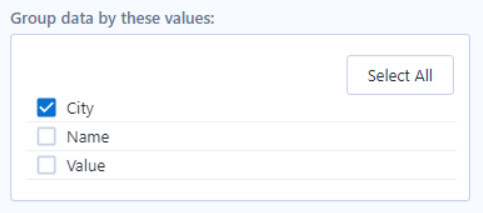
The first step is to choose what we want to group our data by, this is essentially the "key column" option in the transpose tool, where this column won't change and all our data and its values will be grouped for each city
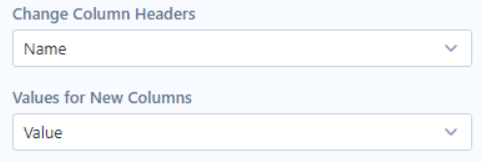
The next step is to adjust the headers. "Change column headers" is basically asking us to assign the new headers for our data, in this case, we want our "names" such as sales, profit, revenue etc to be our headers.
The values we want to use for these columns are our "values" or figures (blue) which means that each value will belong to a measure and city.
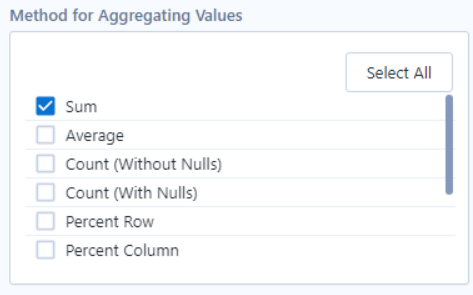
Finally, we want to choose how we want to aggregate this data. As we only have one value for each cell it doesn't matter if we sum or average as the number will be the same. However, if we had other data our selection could alter the data. Similarly, we may want to aggregate using other methods depending on our situation and end goal.
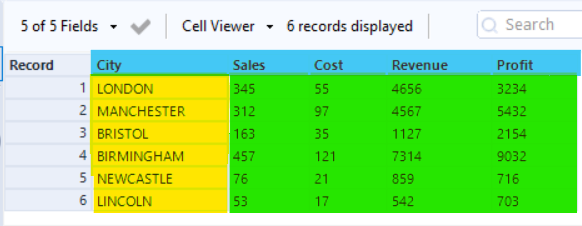
Running the flow will give us our original data set back and revert our changes. This data set is now wider but also easier to read through the human eye. This can be better for reports that need to be printed or shown to someone. Wider data is also easier to work with when using formulas and functions.
There you go. Hopefully, this helped in distinguishing the difference between the two as well as misunderstanding how to set them up and use them.
