What is dirty data and why is it bad?
Dirty data refers to data that contains erroneous, false or missing information. Examples of dirty data can be:
- Duplicate data
- Typos
- Null values
- Wrong formatting
- Data that violates set rules
- Extra value
This is just a fraction and any data that can compromise the integrity of the data set and future analysis can be classified as dirty data.
Dirty data causes inaccurate results and false analysis. This results in wasted resources, loss of time and money. Often having to redo the work done and clean the data.
Using Tableau prep to clean data
We can clean up our data using tableau prep and its abundance of tools.
For this example, we will be using a data set on video games sold by various companies on various consoles throughout the years.
We want to analyse the games released from 2000-2015 and see if the game user and critical rating have any effect on the global sales.
Below we can see the source xlsx file when imported into Tableau prep
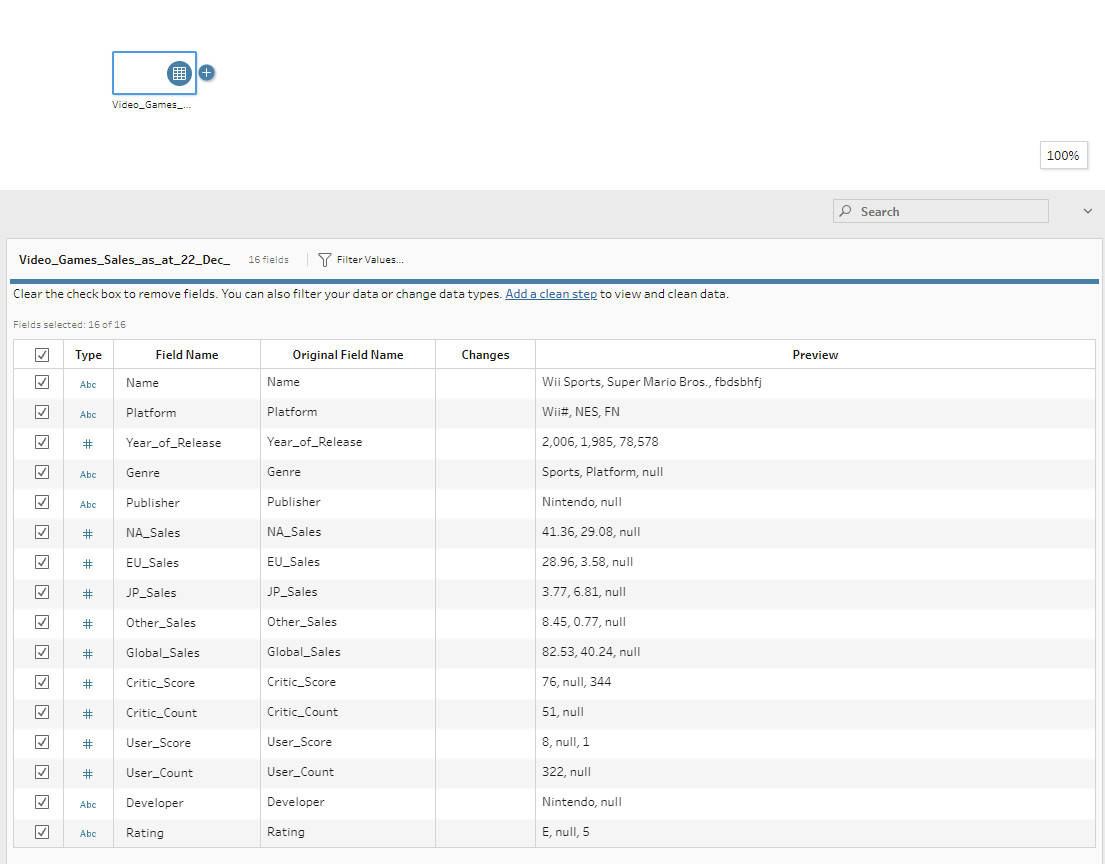
First, we want to identify the information we need. In this case, it would be the name of the game (Name), Year it was released (Year_of_Release), Game scores (Critic_Score & User_Score), and Global sales (Global_Sales).
As we can see our data set is filled with columns and information that we don't need such as region sales, developer, etc.
We can start cleaning this data by filtering out information and columns that we don't need. When first importing the data, under the input function we can choose what columns we wish to keep by either ticking what we wish to keep or unticking to remove from the data set.
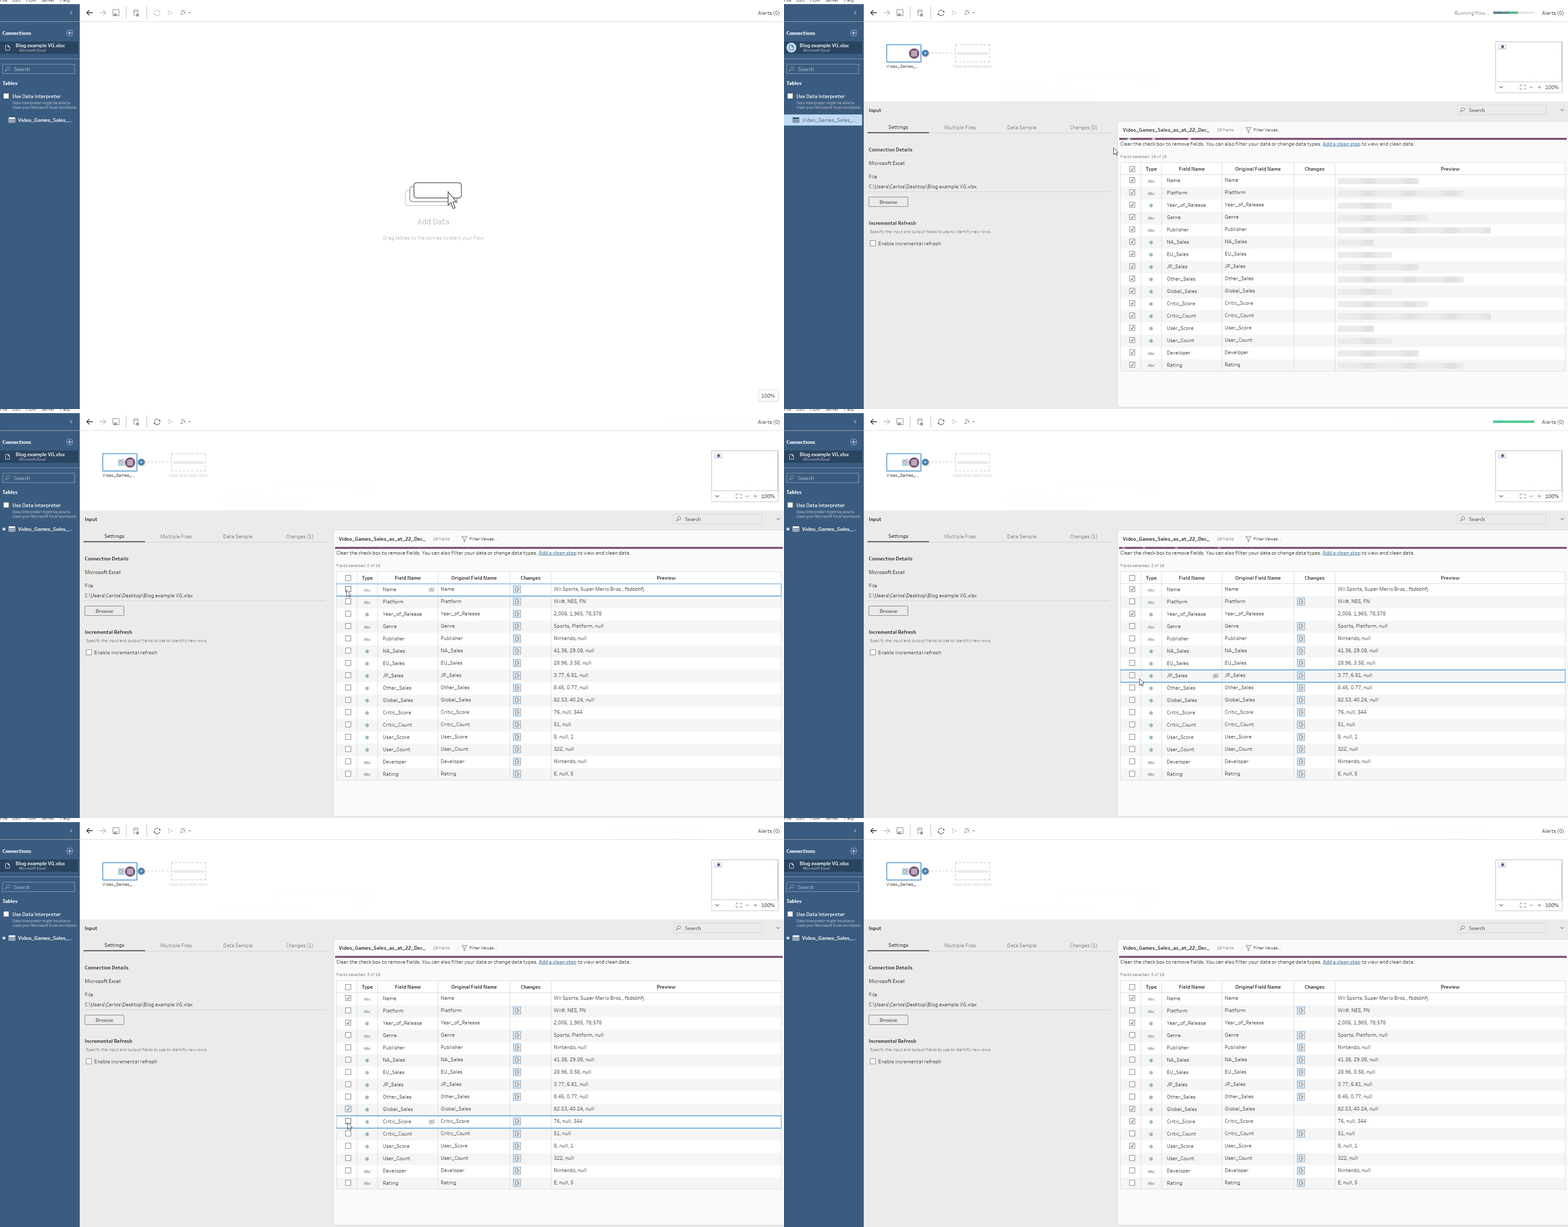
Once we have filtered our data we can move on and insert the next step by pressing the "+" icon and selecting the next step. In this case, we want the clean step option.

Here we can see our fully filtered dataset, visually inspecting this data set we can already see some incorrect, missing, or extra data. Usually, there would be tens of thousands of rows of data (or more), that visual inspection would be impossible. However, for learning purposes and to point out how data can be cleaned, we have a small data set that we can visually inspect.
Below I have circled and annotated the dirty data and what has to be fixed.
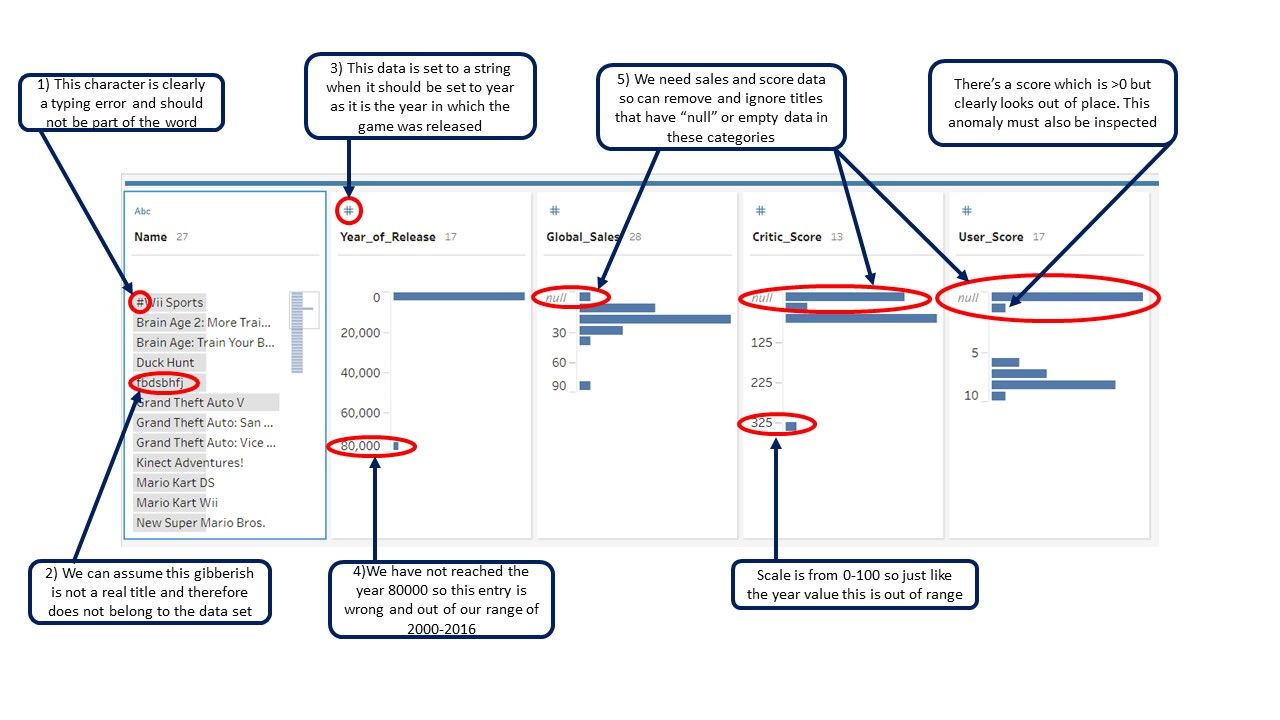
Here we can see what tools to use and how to deal with and correct each one of these problems.
1) Removing Punctuation
If we have a field where we know punctuation should not be present we can use the following tool to quickly remove any punctuation from any data in that column

This is great in instances where you know punctuation shouldn't be present such as names, location, formatted data, or if you know the data should follow that particular rule.
In this case, this is not useful as we have titles such as "Kinect Adventures!" that do use punctuation. In that case, we want to clean the data using a "calculated field" which can be described as a piece of code or algorithm that will look for cells starting with a "#" and removing it, since we know that no game will start with "#".
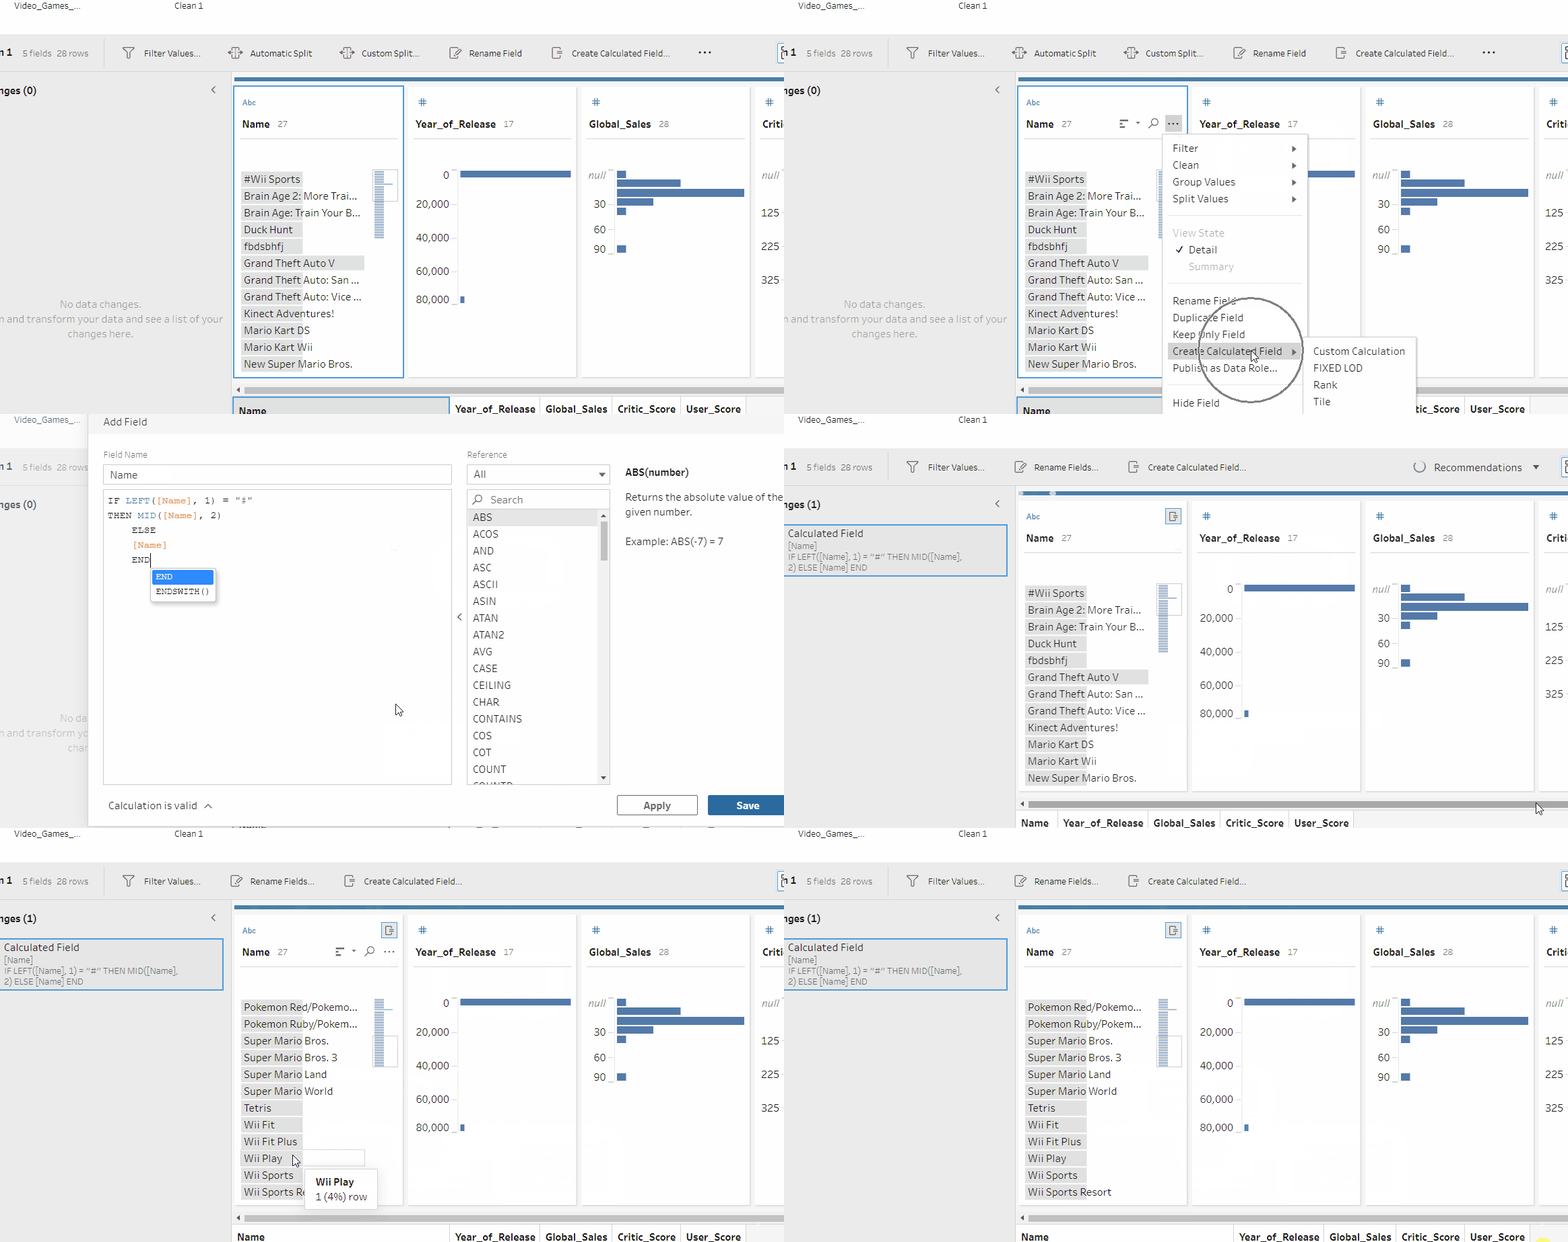
The calculated field goes as follows

We name the calculated field "Name" in order to overwrite the current column, otherwise, a new column will be created
2) Removing a row
In the data set above, we can see the line of gibberish in the 5th row, clearly, this is not a game and when we click on the cell and view the other attached data we can clearly see that this row is completely wrong and needs to be removed. In order to do this, we can just right-click and chose "exclude".
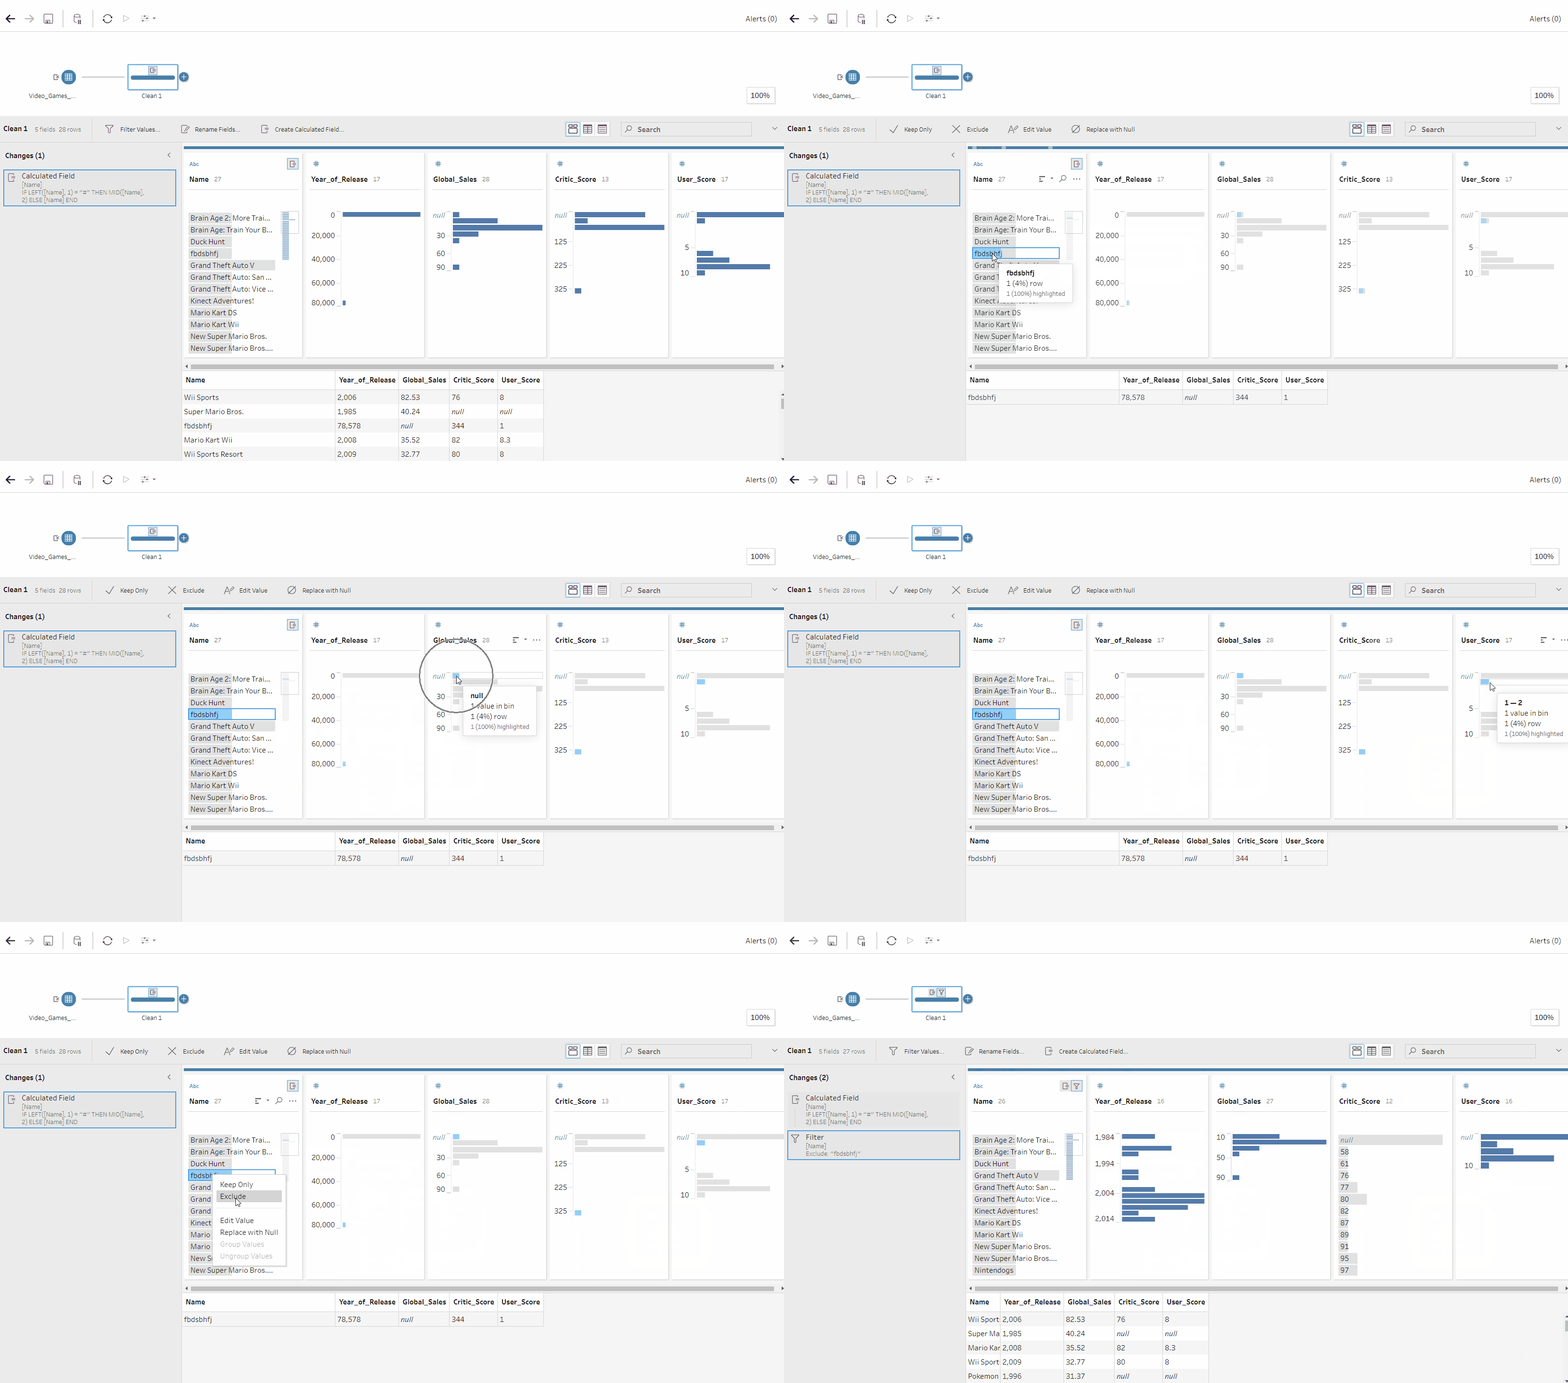
This will exclude all the cells that correspond to that one data point. As we can see here this row was a big contributor to why our data looked so messy and once removed, the data became more balanced and made more sense.
3) Changing data type
Our date column is showing data but as we look to analyse this data in the future we want to make sure that our analytical tool addresses it as the correct data type. In this instance, our date values are set as strings and we want them set to "date" To do this we can just click on the current data type, here it's the "#" and set it to "date".
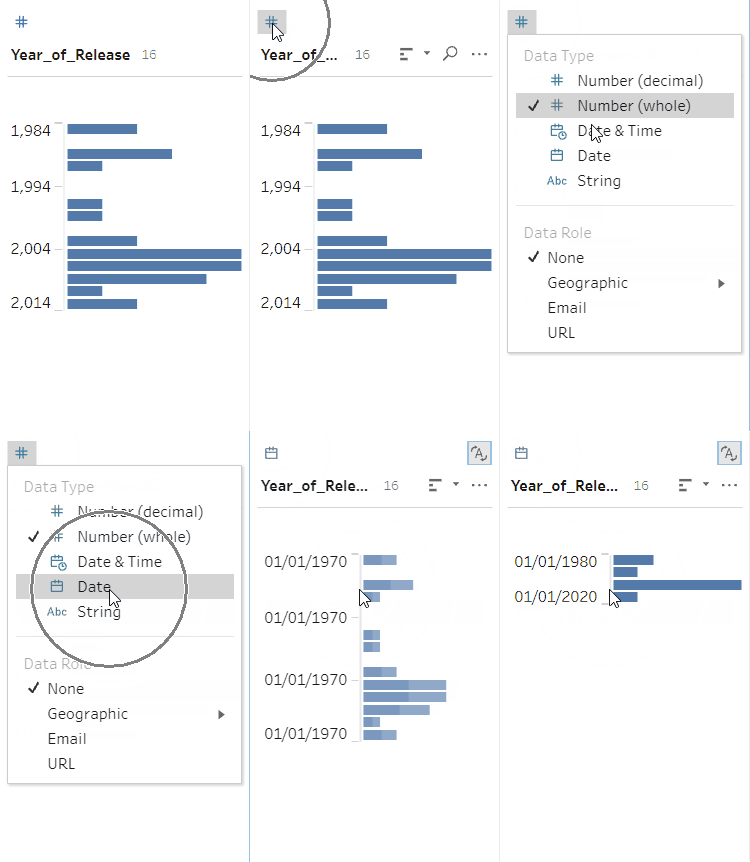
4) Adding ranges
We can see that some of our dates are out of our required range of 2000-2016. We can add a range that will then filter down our data to our required range. This can be used using the filter tool.
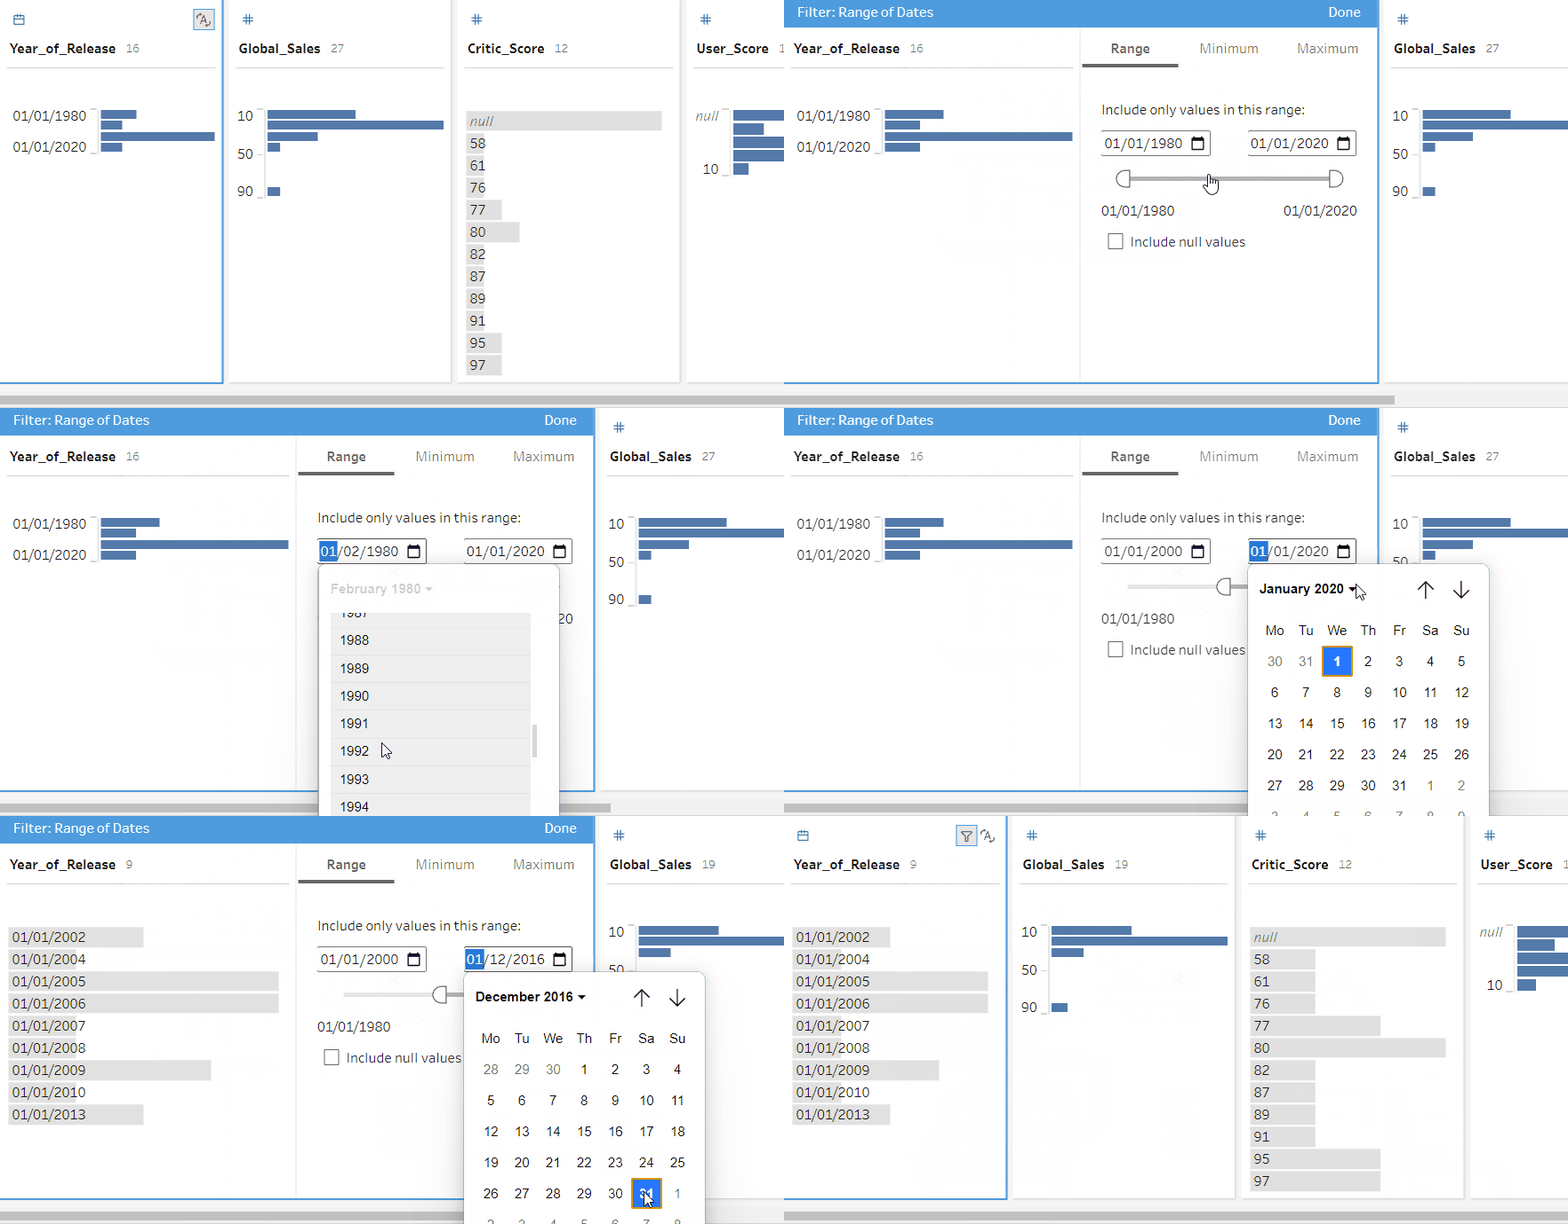
This will remove any date and its corresponding data that falls outside of our range.
5) Removing null values
For our use case, we need data on all of our columns so if we cannot have null data and need to get rid of them. We can see that we still have null data for the critic and user scores. We want to make sure to remove those games from our data.

Using this method we successfully removed all null values from both user critics scores. This won't always be the case but in this instance, if there was no data for critic scores then there weren't any for user scores either.
Just the beginning
This is just the beginning and a handful of tools that can be used for data cleaning. They are also not the only tools that are capable of doing the cleaning we have done. There are many ways to do a specific function, you could select a tool, several or write a calculated field.
There are also many other forms of data cleaning and practices that have not been touched here such as "grouping by" in order to eliminate typos, in data sets that use the same few strings throughout. Or splitting one column into two using the "split" function if the source data has combined two columns erroneously.
Tableau Prep is a simple but powerful program in data preparation where exploration is key to gaining a true understanding of the processes and its functions.
