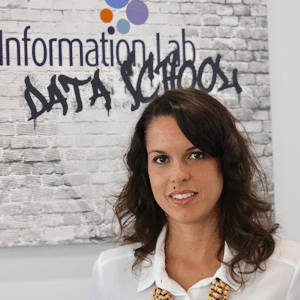
After 10 years working as reporter for several news outlets in Brazil, Rachel started to fell curious about new ways to tell stories – ways using more than words. The idea of working with data visualisation came after seeing “Snow Fall” for the first time (one of the first interactive stories, published by The NY Times). This was the moment in which learning these skills became a plan and Tableau arisen as a great tool to do that (allowing to test formats and colours in a hassle-free way). From her background she brings the obsession with making information accessible for the audience in a clear, effective and beautiful way.
Aside from the Data School, Rachel can be found in coding meetups (fighting against Phyton or JS), yoga classes, taking care of her “pet” (a sourdough called Barackterias), cooking or planning the next trip together with her Portuguese husband.
