


At its core, CALCULATE evaluates an expression in a context that is modified by the specific filters you define. It is the only function in DAX that can fundamentally change the filter context of a calculation.
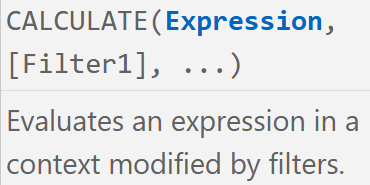
Expression: The calculation you want to perform (e.g. Total Sales).[Filter]: One or more conditions that dictate how the data should be filtered before the expression is evaluated.
Whenever you place a measure into a Power BI visual (like a matrix or a bar chart), the visual applies a set of filters to the underlying data based on the rows, columns, and external slicers. For example, if you look at a matrix showing Total Sales by Segment, the filter context for a specific cell might be Segment = "Consumer".
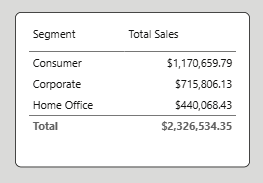
Normally, a basic measure like Total Sales simply respects that visual's filter context. But what if you want a measure that always shows the sales for "Consumer" regardless of what Segment is selected in the visual? That is exactly where CALCULATE steps in.
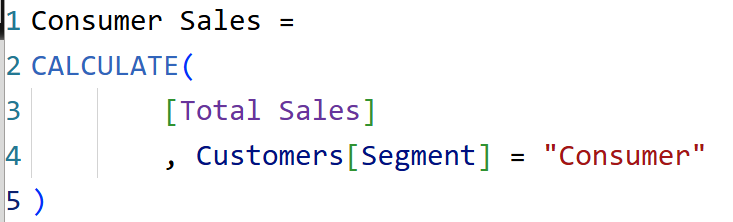
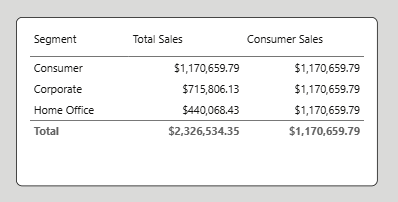
This new Consumer Sales Measure will now calculates the Total Sales but only includes segments where the Segment is "Consumer".
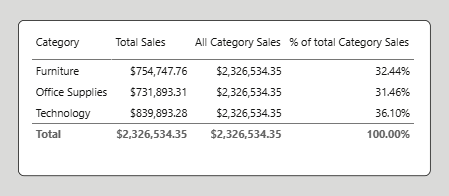
You can use CALCULATE in combination with functions like ALL to completely strip away existing filters. This is incredibly useful for calculating percentages against a grand total.
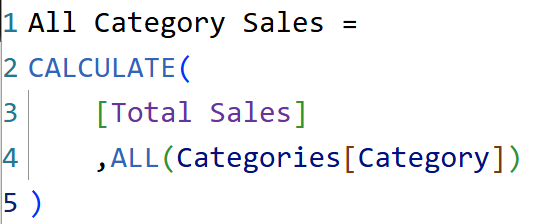
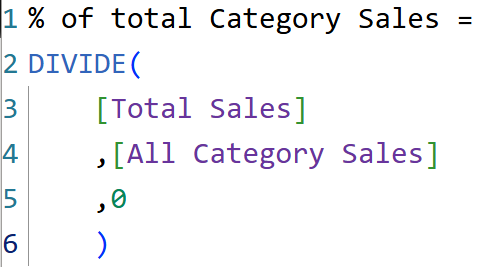
This will calculate our Total Category Sales regardless of any filters applied allowing us to then find our % of total:
While its syntax is simple, its behaviour dictates the core logic of almost every advanced pattern in DAX so the more you can practice getting the hang of it the better!