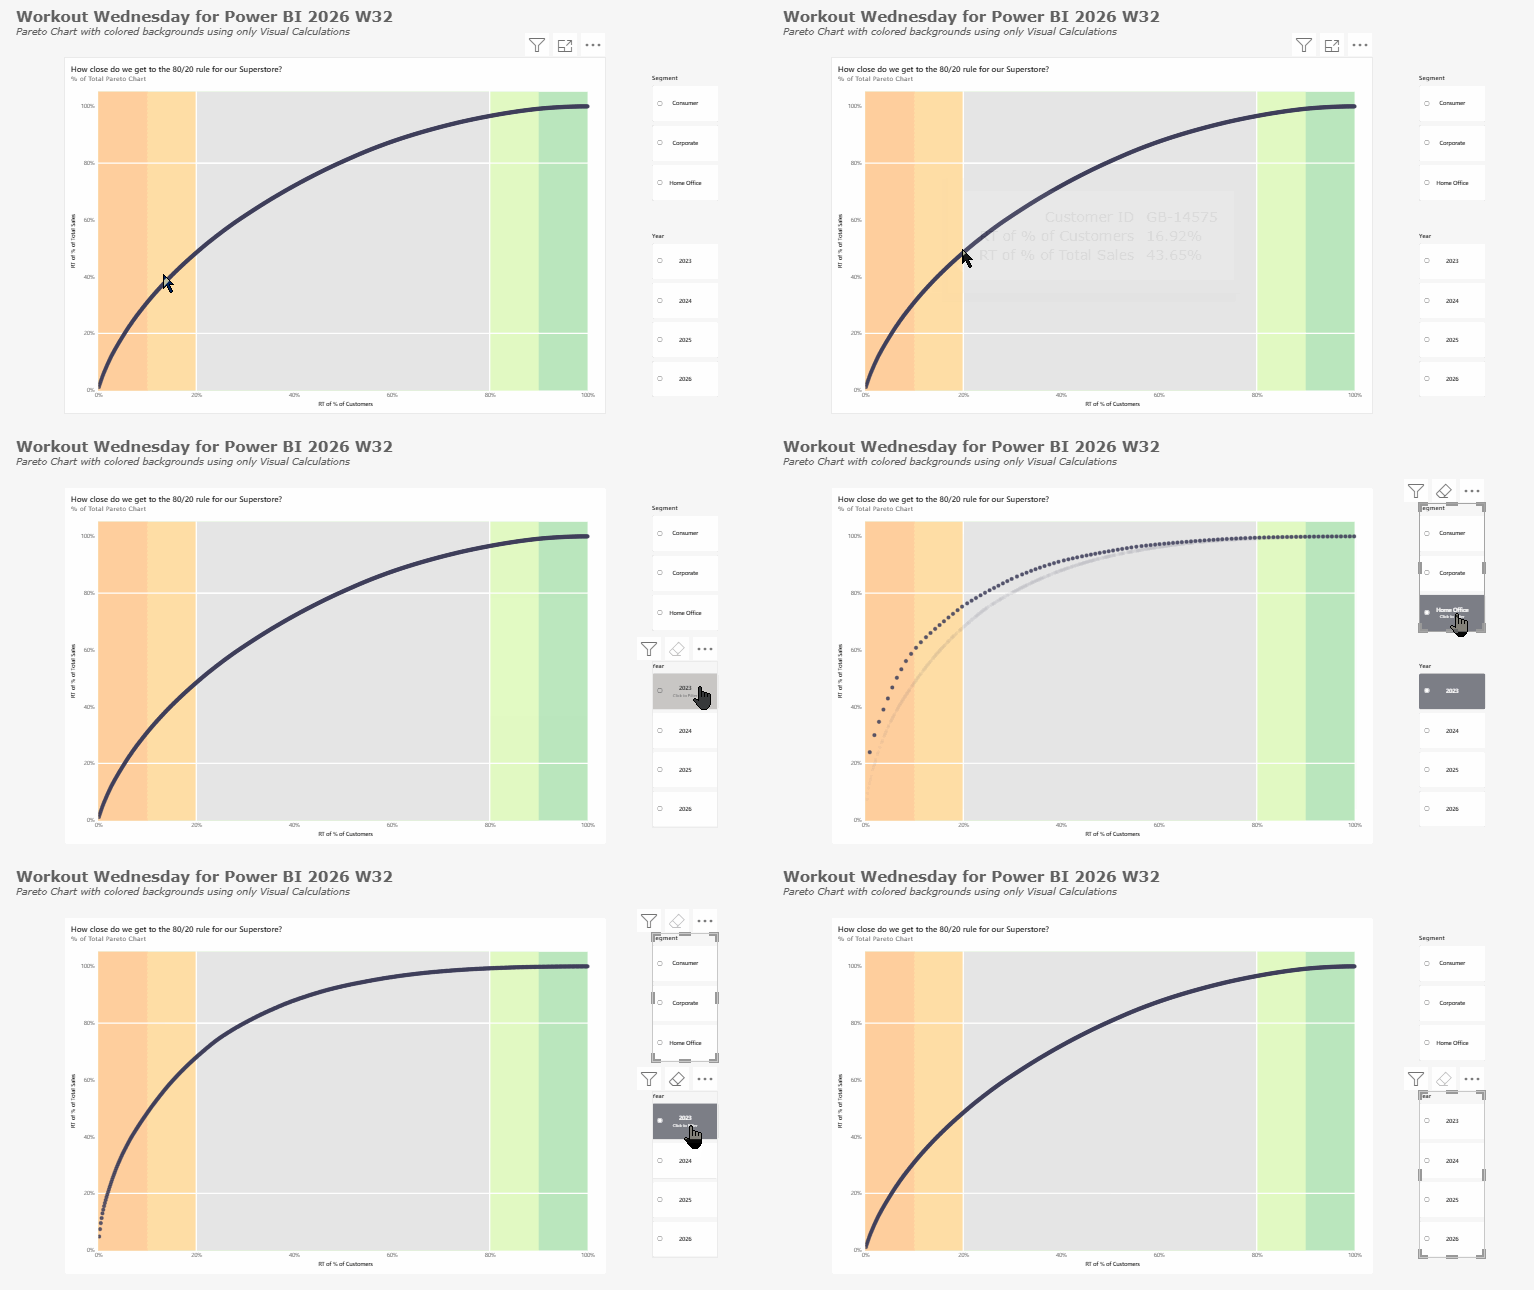
Visual Calculations is a type of calculation found in the Power BI Universe. It is a DAX calculation that you directly on a visual within a report.
They are mainly used when you want to calculate Running totals or Percent of totals of a certain visual.
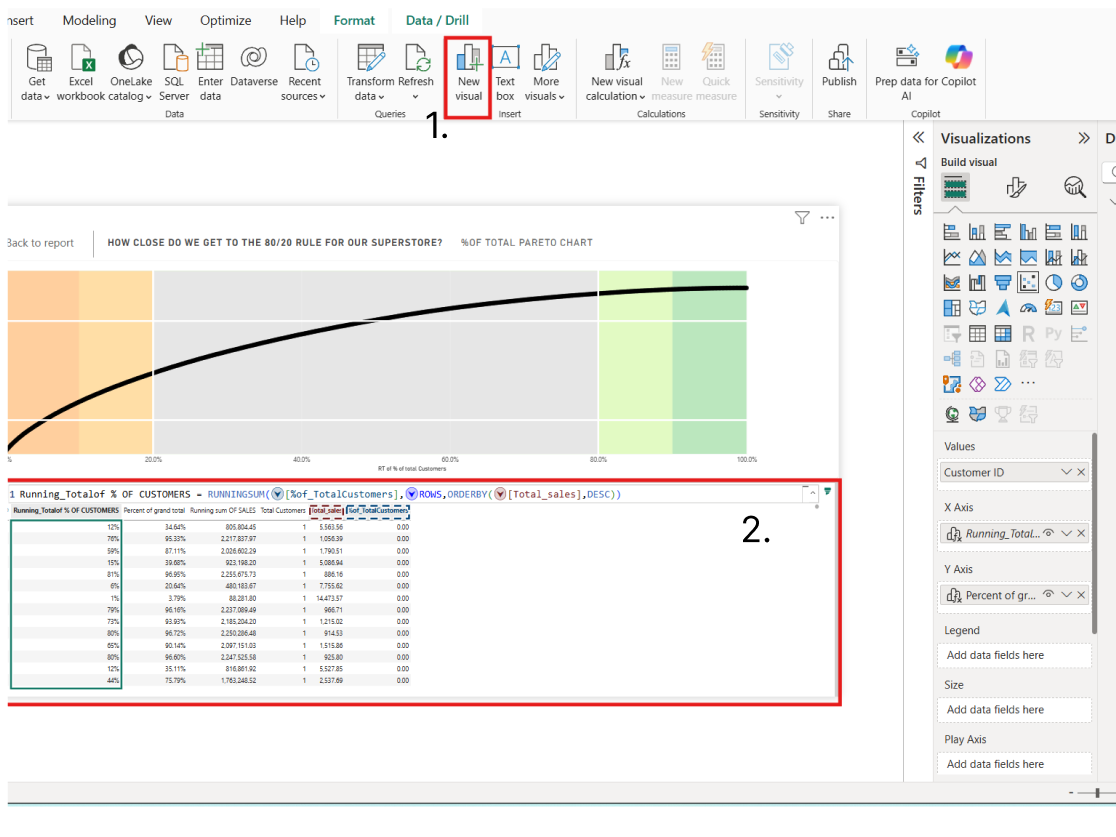
- Once you select your desired visual you will be able to access the 'New Visual Calculation button' located on the home ribbon.
- Once you press the dropdown, you will be able to see a list of prepopulated functions available to you. Once you select on one, your report view will then be sent to the following interface.
- At the top you have the Formula Bar, the same formula bar you see when creating a new measure /column. You can also gain access to the underlying table (Visual Matrix), that is used to construct the Report visual.
I think of visual calculations as being very similar to Table Calculations. In that they are aggregating/ performing calculations on top of the data within the view/ or in this case the report visual.
You may notice big Dropdown icons next to the field names. Interacting with this will allow you to swap out the fields that are present within your visual.
You may also notice an argument/parameter within the DAX calculation called 'ROWS'; this tells the DAX engine how you would like to compute the calculation. So for this example, looking at the Visual Matrix, the engine will compute the Running SUM. Row by Row. Like how you would typically read a table.
Editing a visual Calculation
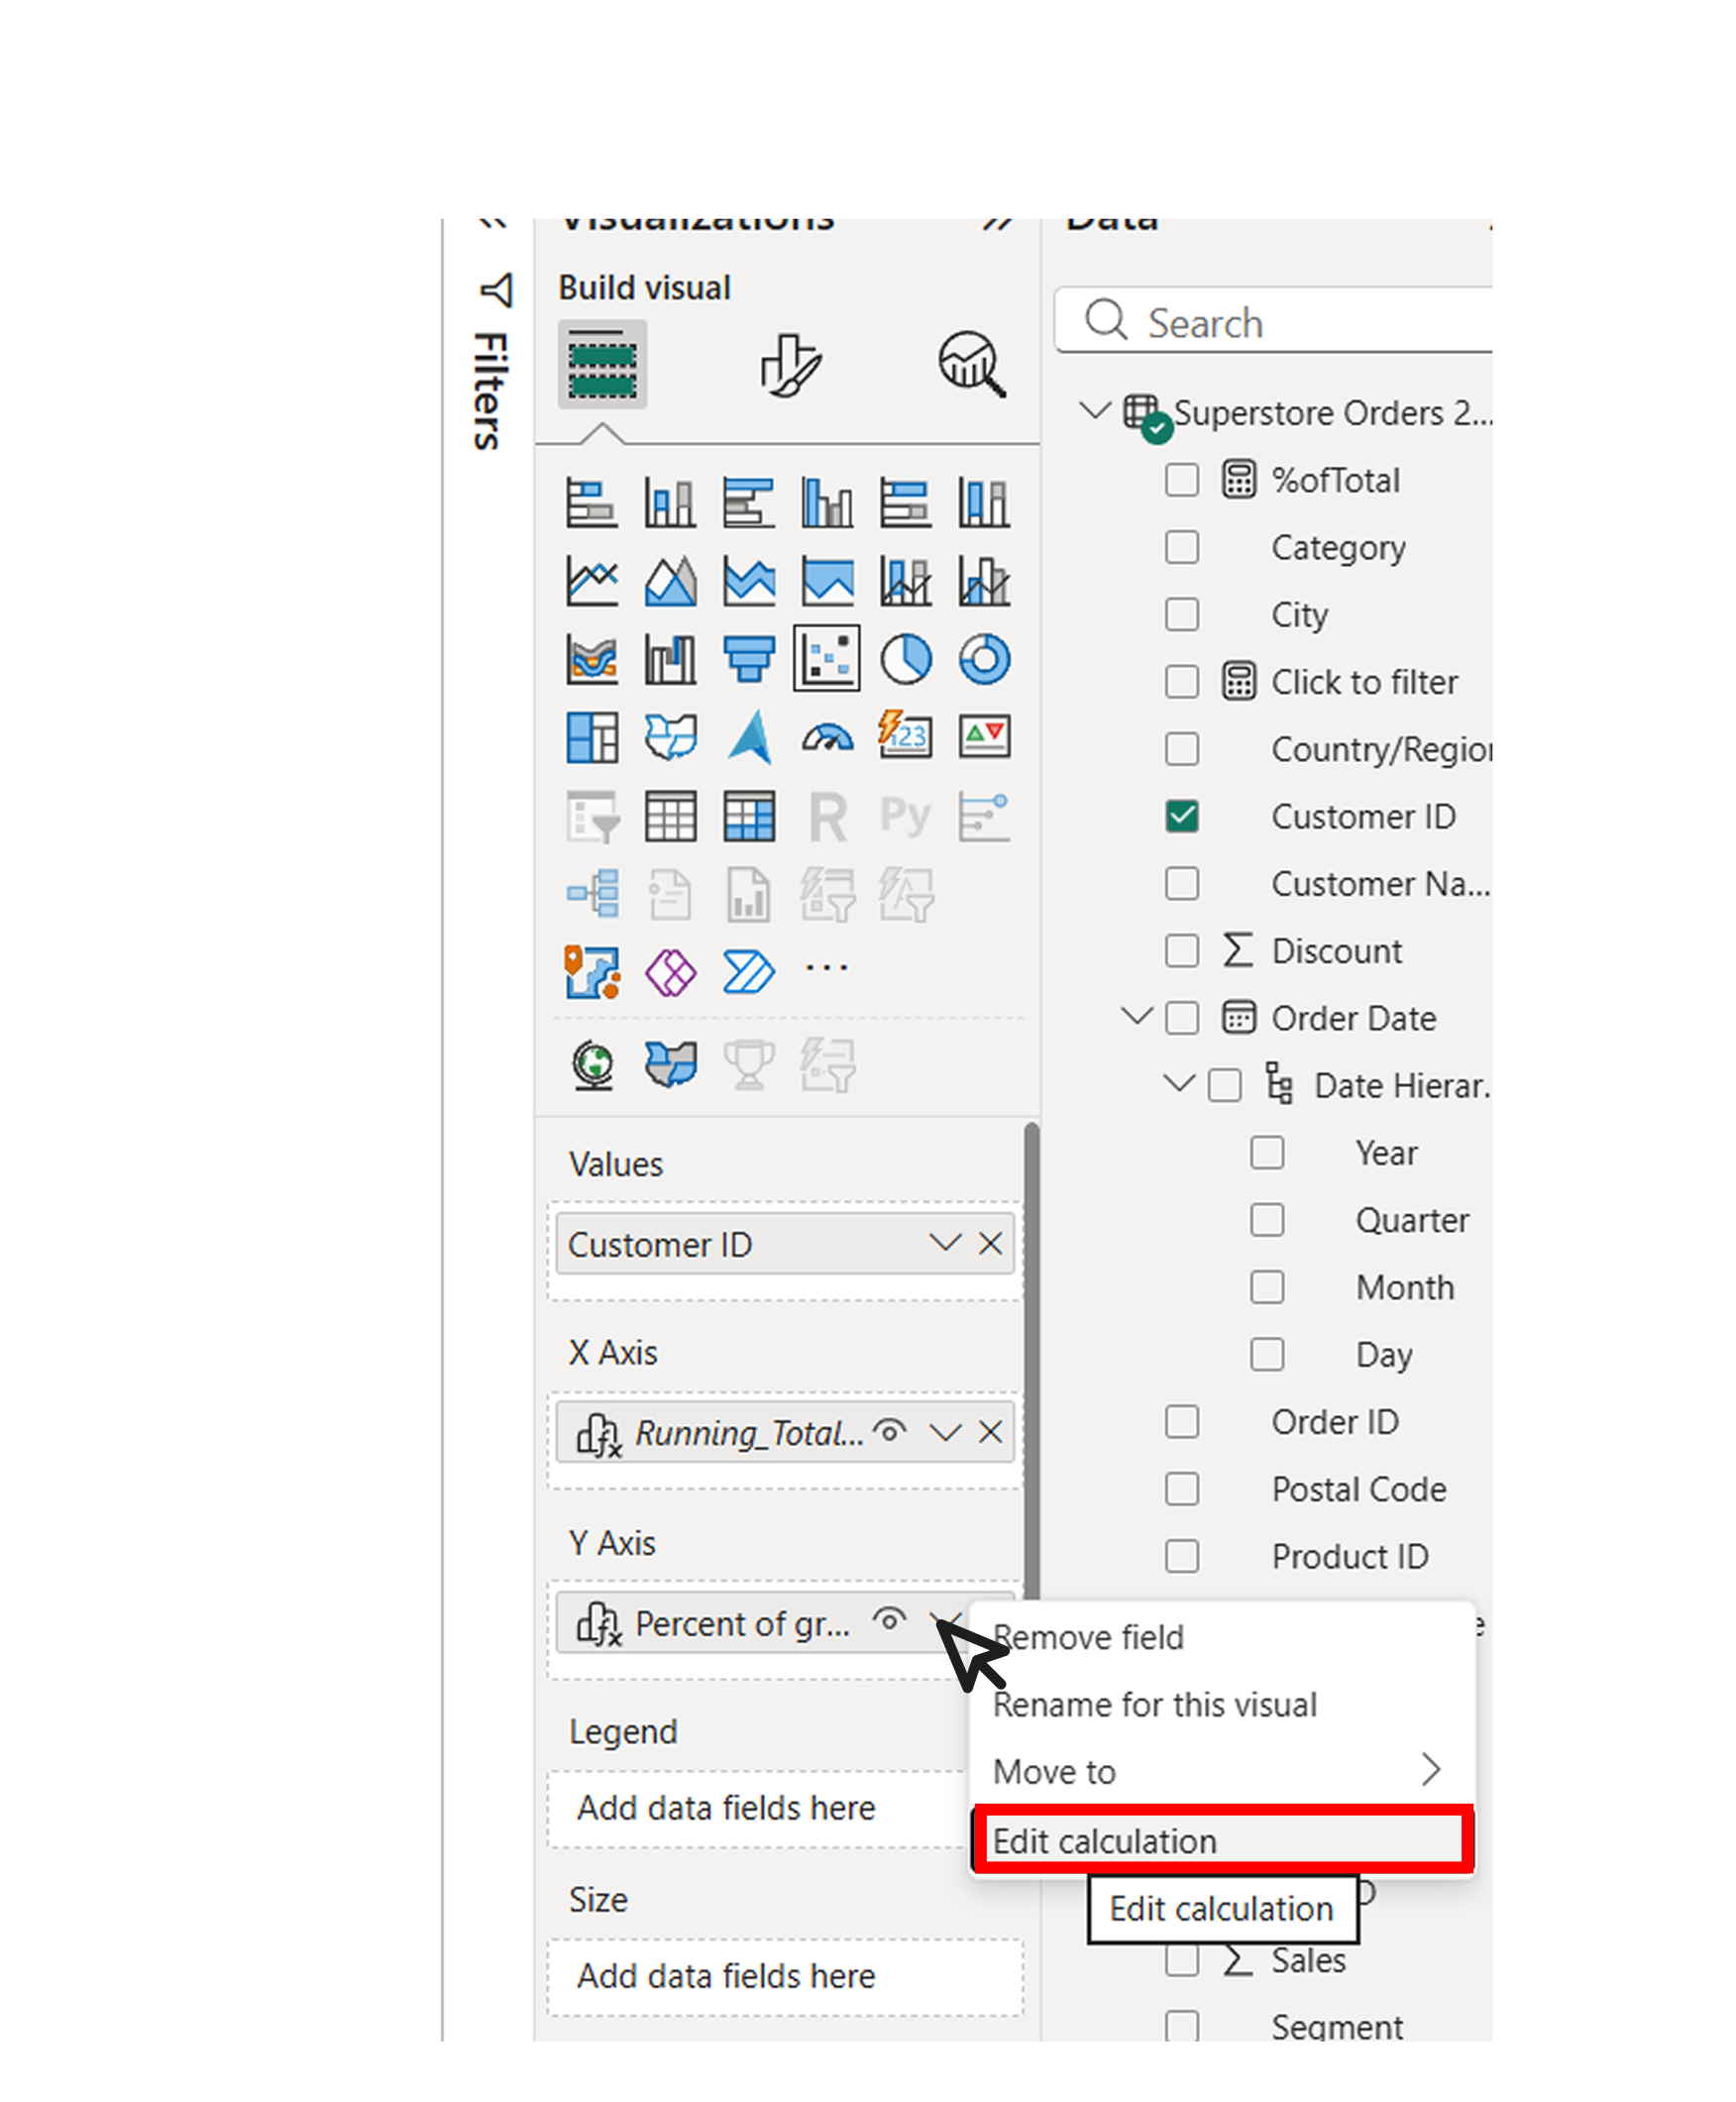
Let say you clicked Back to report, but realised you wanted to change the calculation. You can reopen the previous UI by selecting the dropdown arrow and selecting the 'Edit calculation' button.
Advantages vs Disadvantages.
Advantages
- The DAX is simplified, since you are only focused on what is within the visual. You don't necessarily have to worry about Filter context here.
- Performance advantages. These calculations operate on aggregated data, which would result in smoother performance (however, this is dependent on other factors within the report)
Disadvantages
- Isolated to the Visual, the calculations operate on a report visual level. not in the data model. and thus can only reference data that is currently in the visual.
- Can't be published to Web Visuals containing these calculations can't be pinned or be published to Web.
Credits
The Visual/ screenshots used in this blog came from my own attempt at the following Workout Wednesday :). Give it a go!
 Robbin Vernooij