In this blog, you'll learn how to create a dynamic KPI in Tableau that displays the percentage change in Sales from the previous month. Using the Superstore sample data, we'll incorporate a month-based parameter so users can easily select and compare sales in different months.

- Format your Dates Accordingly:
- Right click Order Date -> create -> custom date
- Detail -> months
- Name this 'Order Date (Months)'

Create Order Date Months Parameter:
- Right click on order date months -> create parameter
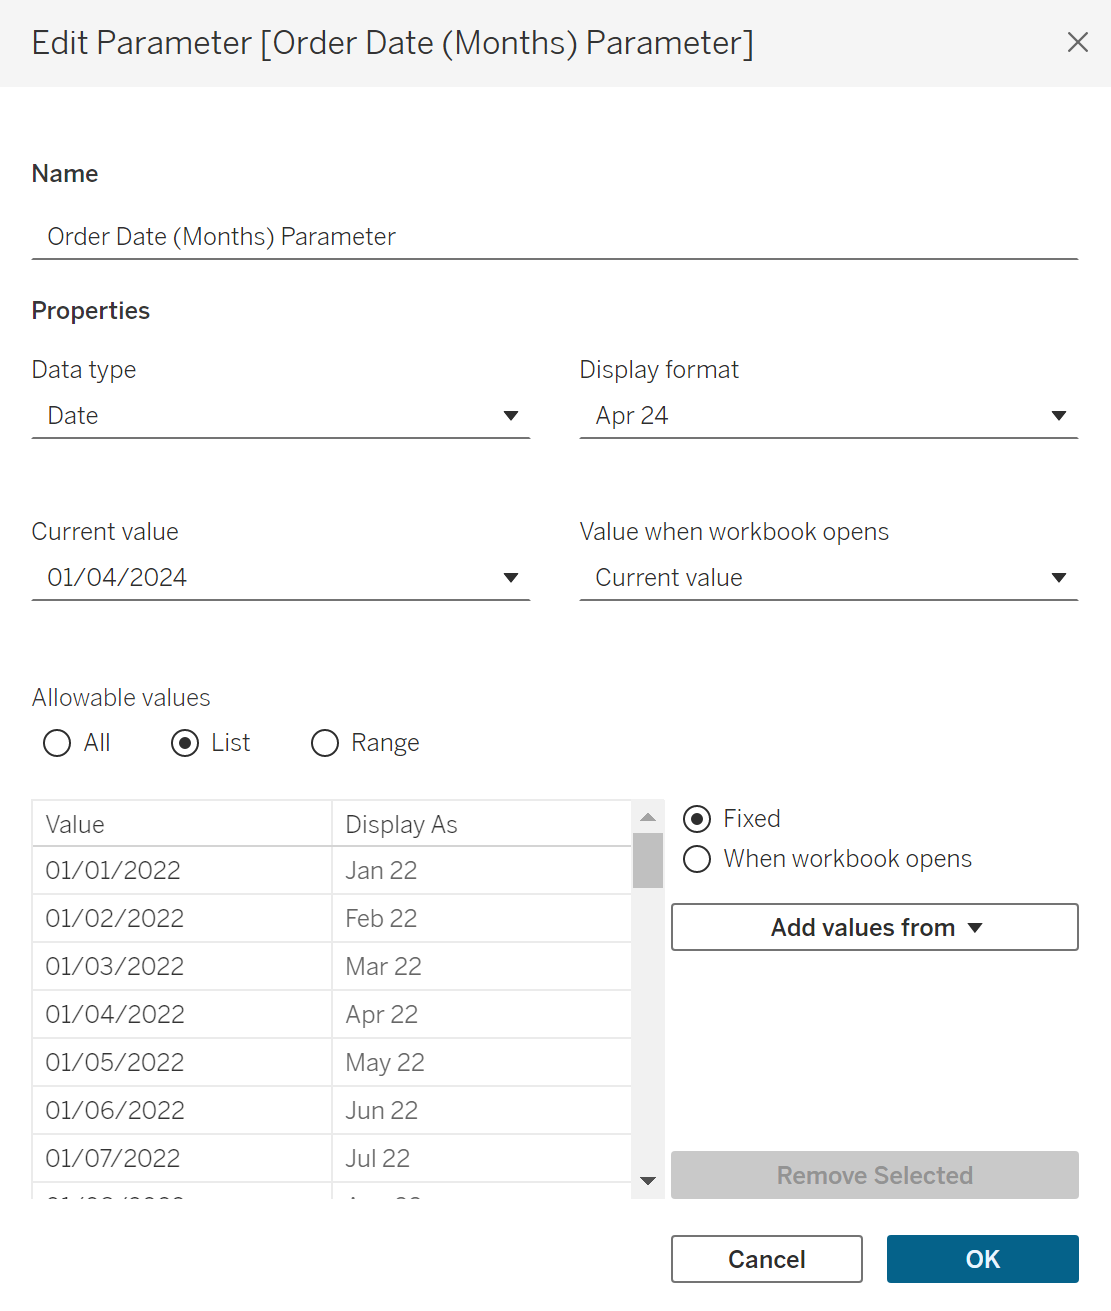
- Display format will be in mmm yy format for this example
Create Calculated Fields for the parameter selected month and the prior month
Parameter Selected Month
- IF [Parameter] = [Order Date Months] THEN [Sales]
- This will show the sales of the month selected by the parameter
Prior Month to Parameter Selected Month
For the prior chosen dates sales, in this case the previous month:
- IF DATEADD(‘month’,-1, [Parameter] = [Order Date Months] THEN [Sales] END
The DATEADD function is used to add or subtract days, weeks, months, years etc from the selected date and will be used to analyse the difference in sales
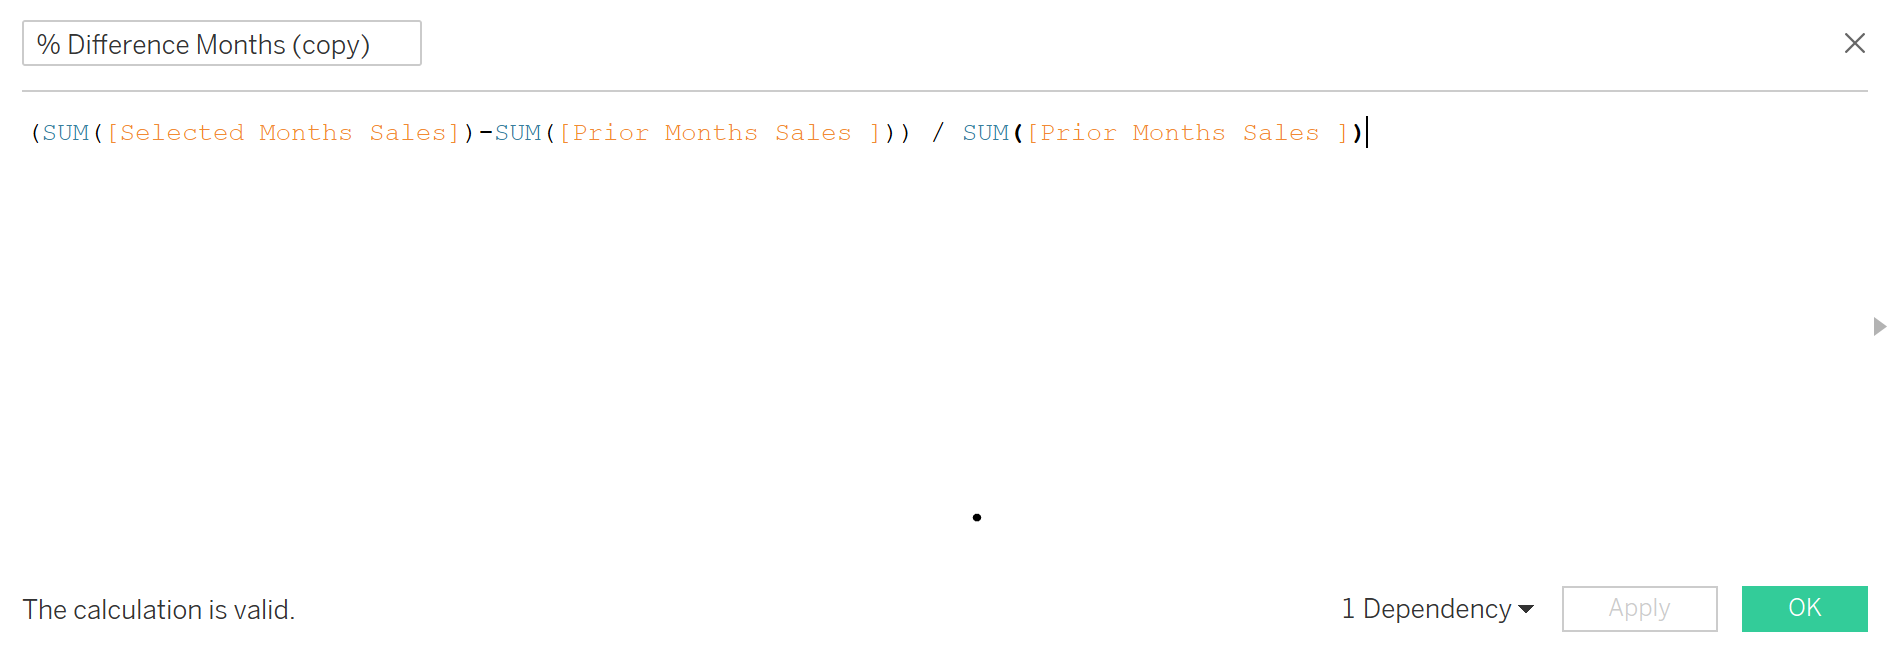
- Now that we have the parameter selected month and the month prior, we can find the percentage difference between them:
- Create the calculated field:
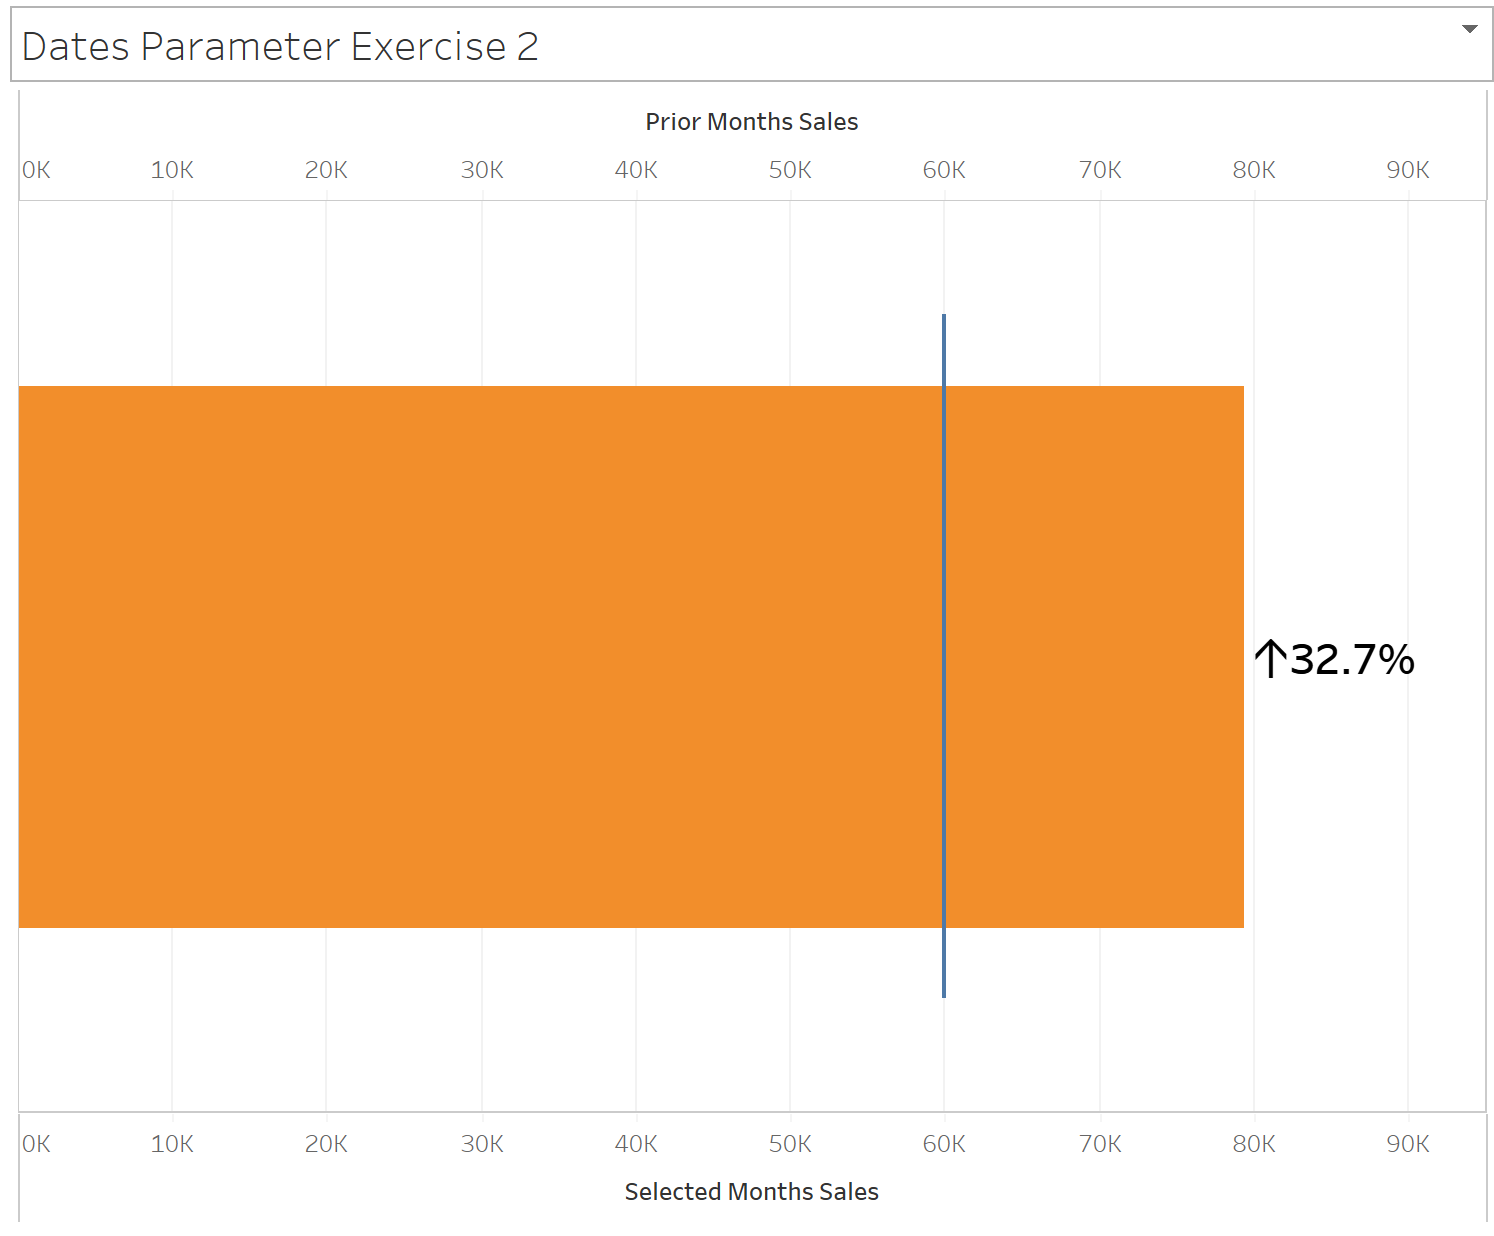
CREATING THE BAR CHART
- To create a bar chart that shows the current year’s sales, create a dual axis by putting both the selected month and prior month (or whichever date measure you end up using) in Columns, right clicking either green pill and selecting 'Dual Axis'
- Synchronise the axis
- Change the Prior Date to a Gantt chart in the marks card, this will create the blue bar along the graph that sets the point of sales of the previous month
- Change the Selected Date to a Bar chart in the marks card
- Add 'Measure Names' to Colour, Prior month to blue and selected month
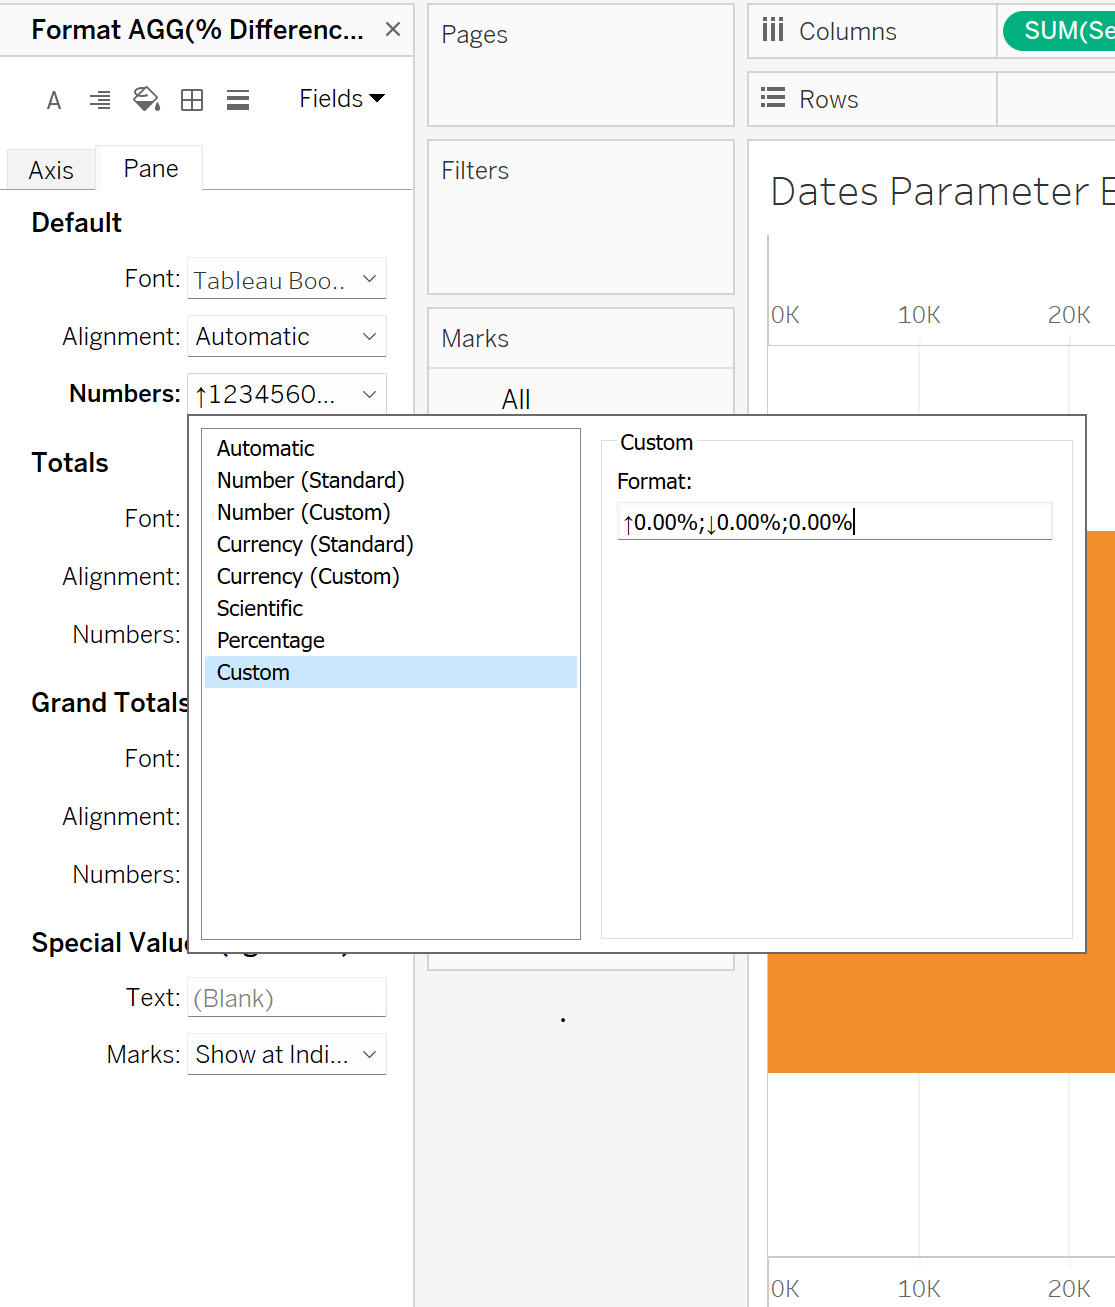
- Right click % difference pill -> default properties -> number format -> custom (turn to percentage format and add arrows using Windows and . key, (geometric symbols) ) ↑0.00%;↓0.00%;0.00%