


When you’re building dashboards in Tableau, it’s not just about showing data! It’s about creating a story that helps users to explore patterns, and ask questions. That’s where sets and set actions come in. They add depth to your analysis and allow for powerful interactivity beyond filters or highlights.
In this blog we’ll break down what sets are, how to build them, and how to set actions that can turn a static dashboard into an exploratory experience using the greatest dataset of them all, the Superstore Dataset.
What Are Sets in Tableau?
At their core, sets are custom fields that define a subset of your data. Think of them as flexible “groups” that can be fixed or dynamic.
In fixed sets we select members manually. In dynamic sets members are updated automatically based on conditions (e.g., Top 10 Customers by Sales).
For example in Superstore you might want to focus on Top 10 Customers by Profit. Creating a set allows you to mark those customers, compare them against the rest, and reuse that logic across different charts.
Unlike filters, sets don’t just exclude data. They give you the ability to:
- Compare In vs. Out of set directly
- Reuse the same definition in multiple visualizations
- Combine sets for advance analysis
Creating a Basic Set in Tableau
Let’s walk through a quick example for creating a Top 10 Customers
- Open the Superstore dataset.
- Go to the Customers dimension, right-click, and choose Create Set.
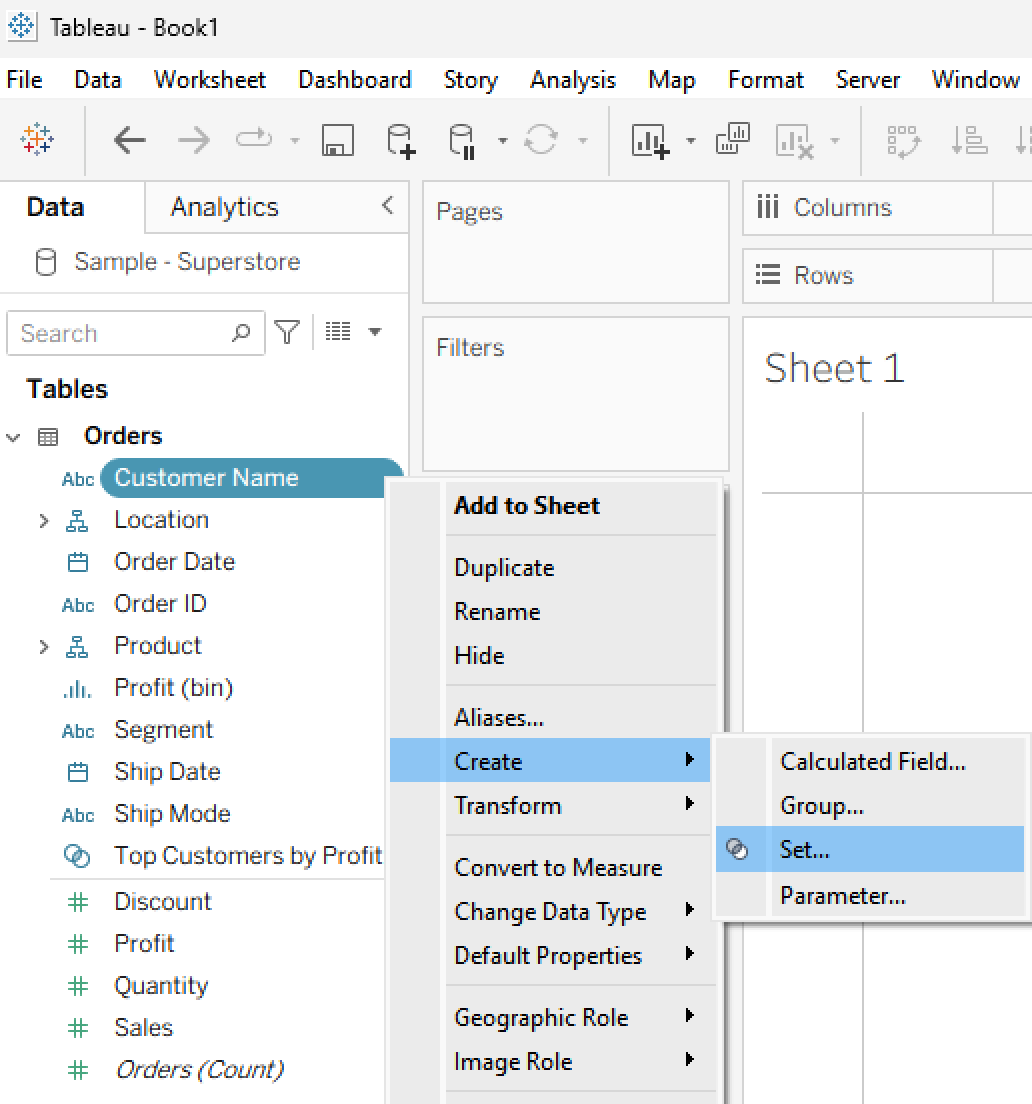
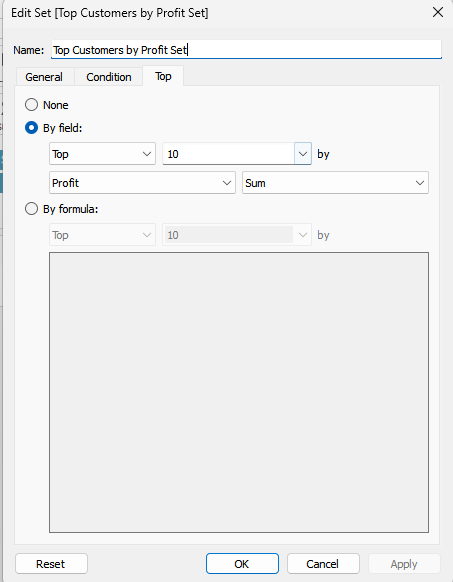
3. In the dialog box, select Top → By Field → Top 10 Customers by Profit.
4. Now we can use our set to help us answer the question:
“Are my top customers high-sales, high-profit or just one of the two?
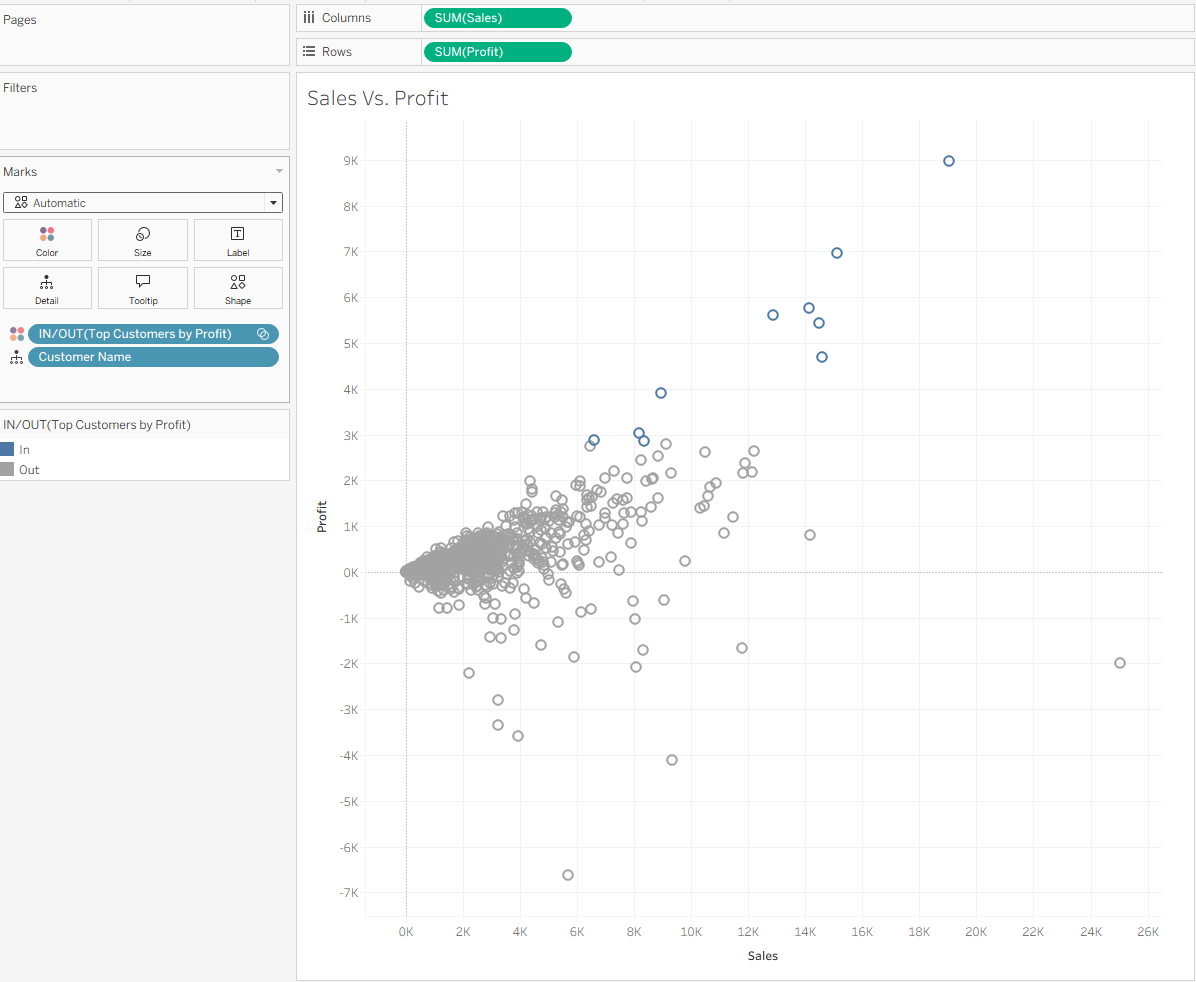
- First let's build simple scatter plot “Sales Vs. Profit” chart
- Place “Sales” measure onto Columns and “Profit” measure onto Rows.
- Add “Customer Name” dimension onto Marks card -> Detail
- Now we place our “Top Customers by Profit Set” onto Color
Instantly, you’ll see who belongs to the Top 10 and who doesn’t.
Combining Sets
Another advantage is the ability to combine sets. Suppose you create:
Set A: Top 10 Customers by Profit
Set B: Top 10 Customers by Sales
- First let’s create Set B: Top 10 Customers by Sales, follow the same process as we did for Set A.
- Right-click one set and choose Create Combined Set.
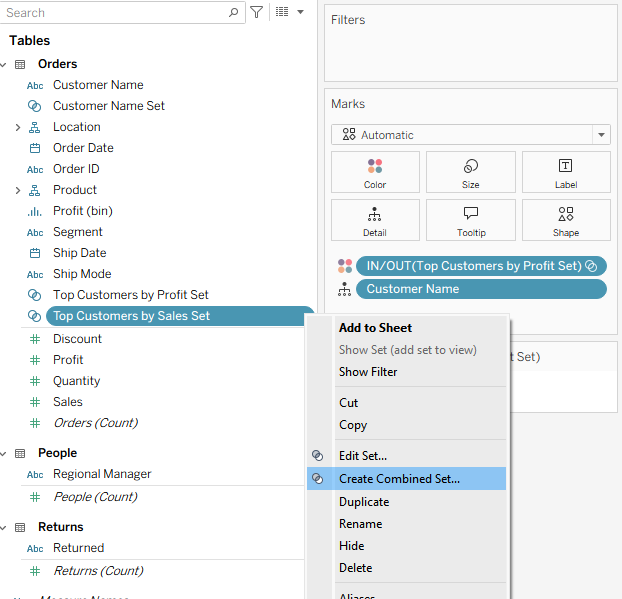
In the next pop-up window we are able to select how we want our set to be created
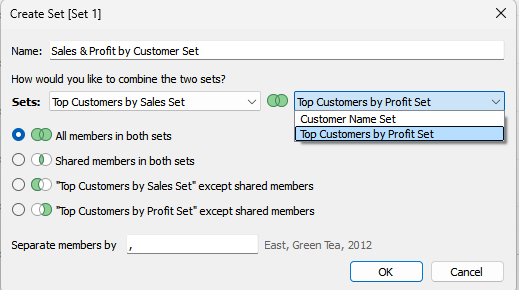
All members in both sets -> Intersection
- Returns only members that exist in both sets.
- Example: Customers who are Top 10 by Sales AND Top 10 by Profit.
Shared members in both sets -> Union
- Returns members that exist in either set (or both).
- Example: Customers who are Top 10 by Sales OR Top 10 by Profit.
“Top Customers by Sales Set” except shared members -> Difference
- Returns members that are in the Sales Set but not in the Profit Set.
- Example: Customers who are Top 10 by Sales but NOT Top 10 by Profit.
“Top Customers by Profit Set” except shared members -> Difference
- Returns members that are in the Profit Set but not in the Sales Set.
- Example: Customers who are Top 10 by Profit but NOT Top 10 by Sales.
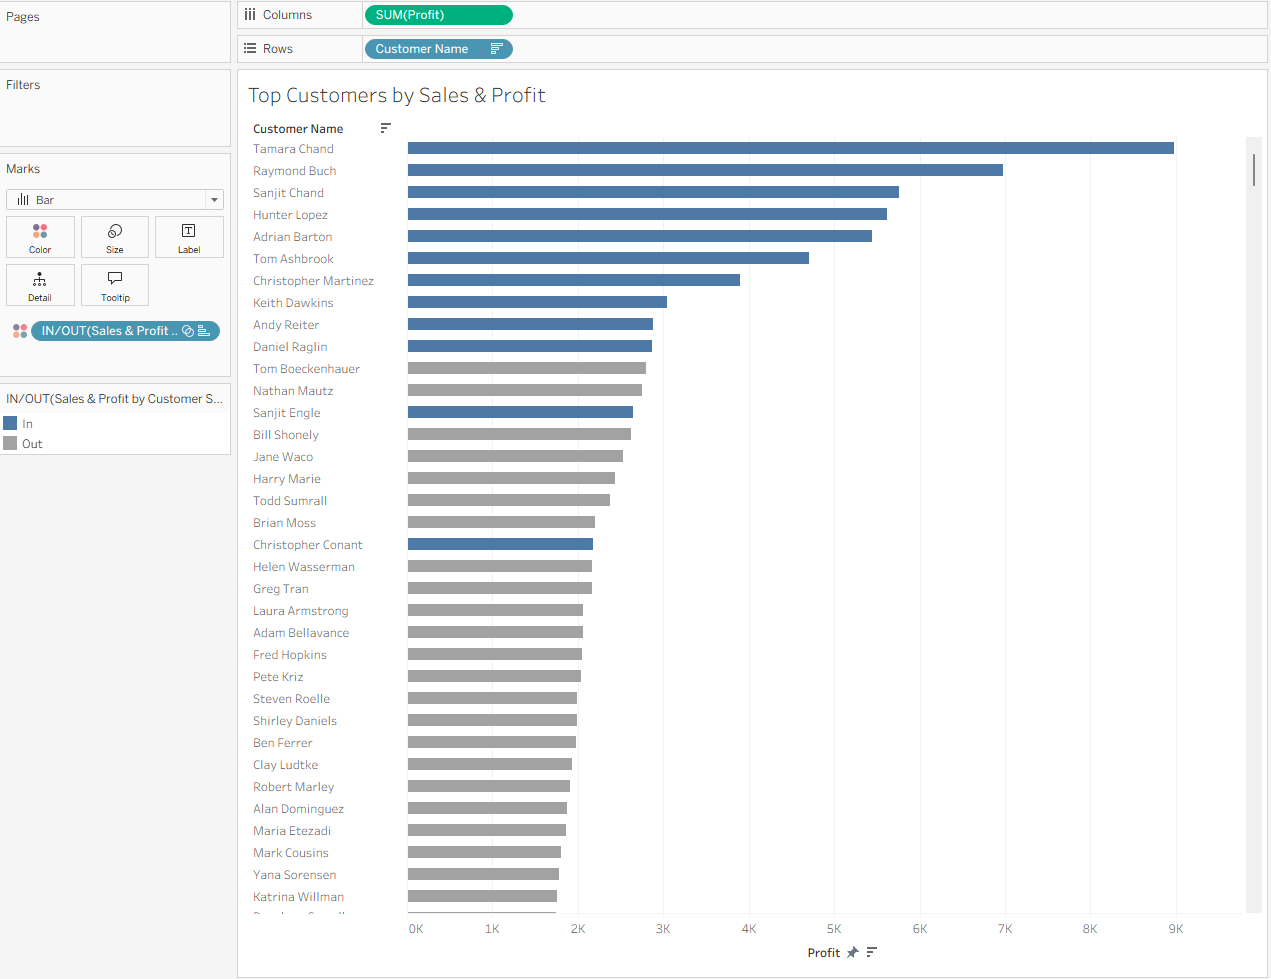
For our Sales & Profit by Customer Set we want all members in both sets.
We can visualize this with a bar chart showing Sales or Profit by these categories. This quickly surfaces our ideal customers, the ones driving both revenue and profitability.
Creating sets is just the beginning. In the next part, we’ll unlock the magic of set actions and learn how to make data exploration more fun and interactive.