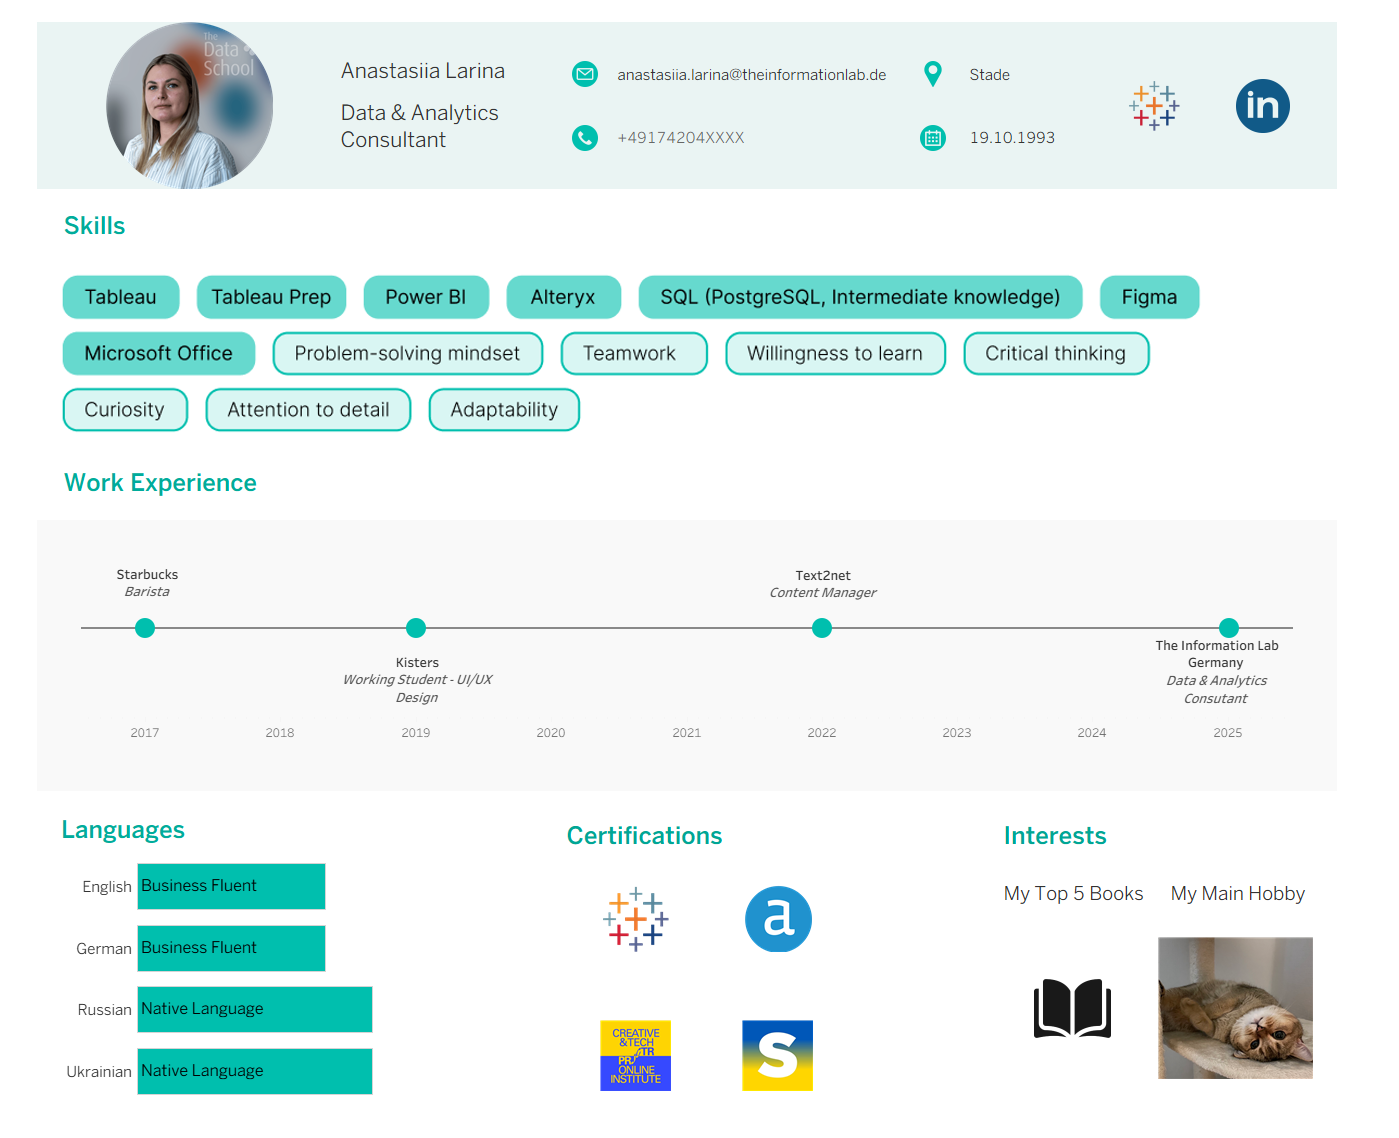
Today we worked on our second dashboard for Dashboard Week, and the task was to design a résumé using Tableau. It was definitely challenging in some parts, especially because my original CV was created in Figma, where you have much more control and flexibility when designing elements. Still, with a bit more time, it actually turned into a really interesting creative challenge.
My initial idea was to keep some elements from my PDF version — the same color palette and the skill buttons for hard and soft skills — and then add a timeline for my work experience, followed by sections for languages, certificates, and interests. What I didn’t expect was how tricky it would be to rebuild those skill buttons in Tableau. I spent quite some time trying different approaches, but for now, in the first version, I decided to simply use the ones I created in Figma.
I also have a few ideas for the next iteration: adding locations and maybe even a map of the places I’ve worked, and — if I manage to recreate the skill buttons in Tableau — adding interactivity so users can click on a job title and see the relevant skills highlighted. Since I’ve worked in three different IT areas so far, I think it would be a great way to show how my skills developed across roles. And my interests section still needs a bit of fine-tuning as well.
All in all, it was a really fun task, and I’m excited to work on Version 2!