


Stepping into my first week at The Data School, I quickly realised that the key to success in data projects starts long before the first dashboard is built. Understanding data—where it comes from, how it’s structured, and how to prepare it—lays the foundation for meaningful analysis. A well-prepared dataset ensures smoother workflows, more reliable insights, and a more efficient analytical process.
Let’s start at the beginning… what is data?
Data is the foundation of any analysis, providing the raw facts or numbers collected from observations to enhance our understanding of a subject (Data Curious, 2023). However, raw data is rarely in a usable state from the get-go. Before it can be effectively analysed and visualised in dashboards, it undergoes a structured process known as Extract, Transform, and Load (ETL):
- Extract: Data is collected from its original source, whether it's a database, spreadsheet, or external API.
- Transform: The raw data is cleaned and prepared for analysis, ensuring consistency and usability.
- Load: The processed data is stored in a designated repository, making it accessible to analysts and decision-makers.
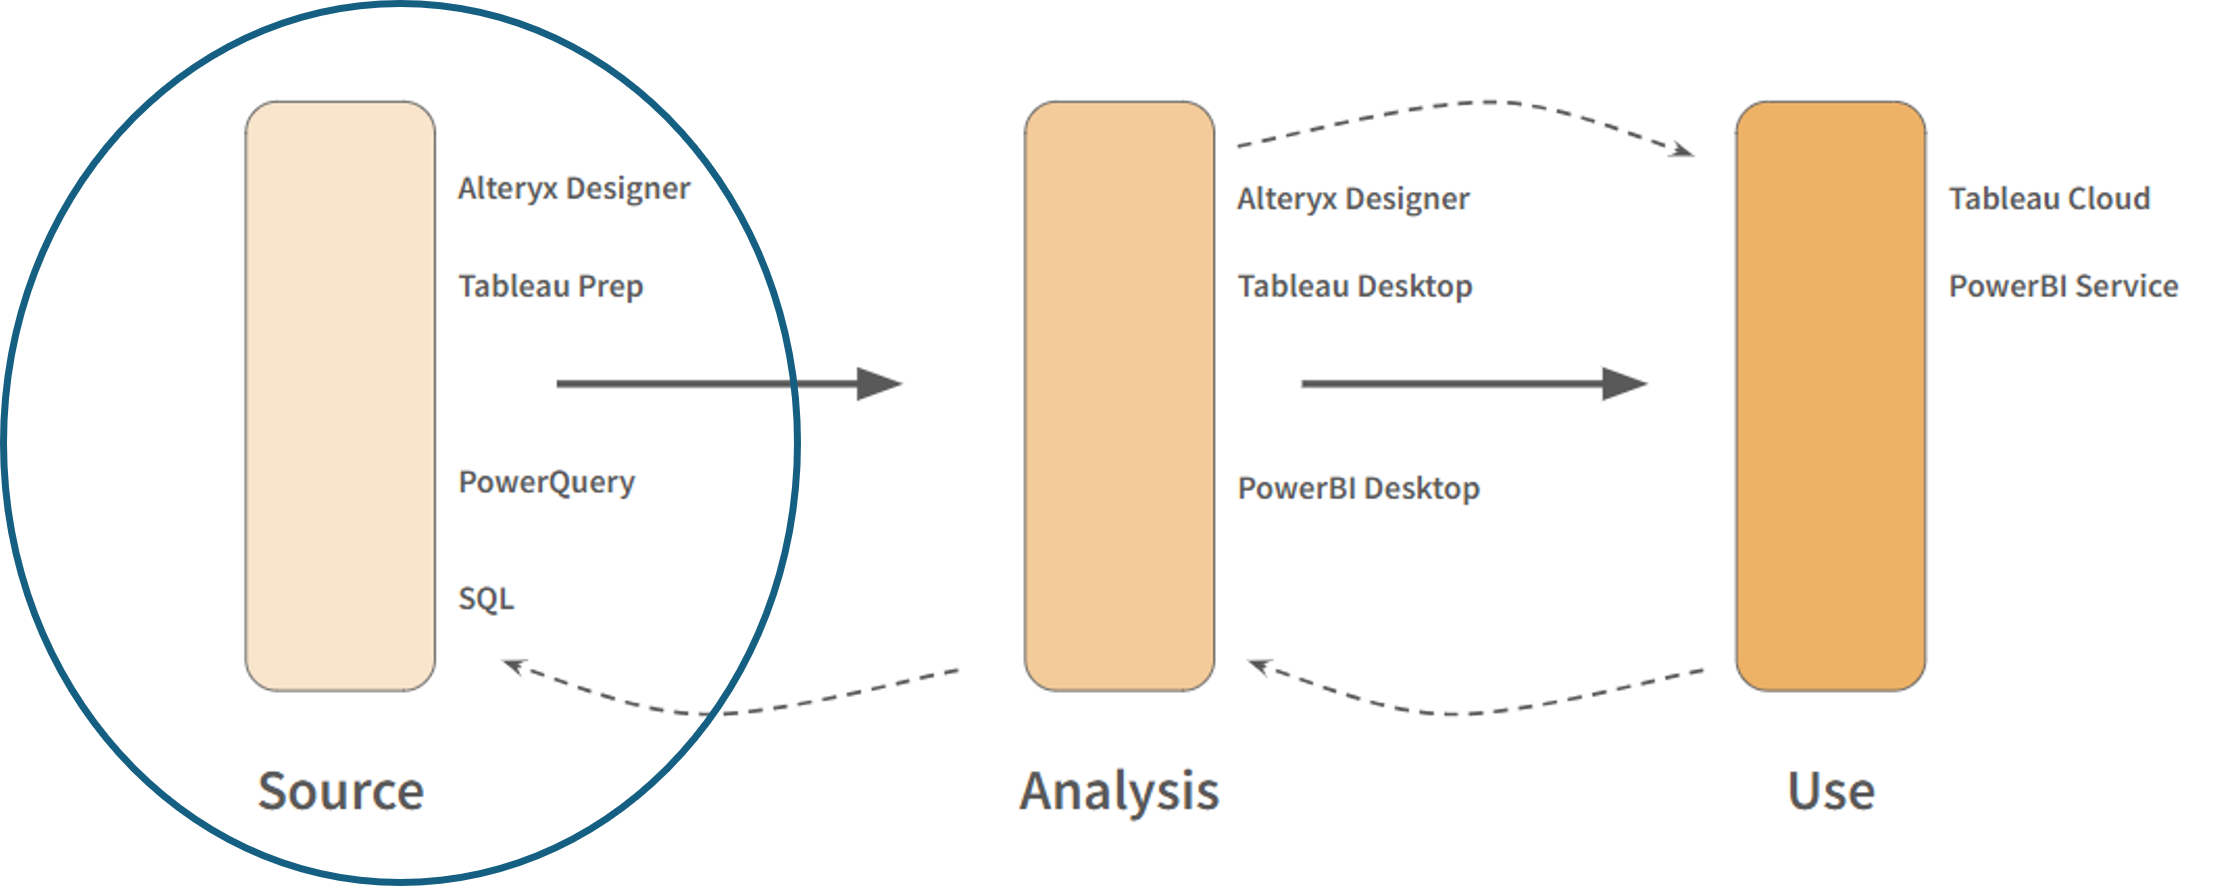
Data follows a simple yet essential flow—from a source, to being analysed and ultimately being used by key stakeholders. This process might sound straightforward, but each step comes with its own challenges. In my first week at The Data School, we focused on best practices around data preparation and planning projects in the initial stages of data handling.
Planning and preparing data
1) Know your data (KYD)
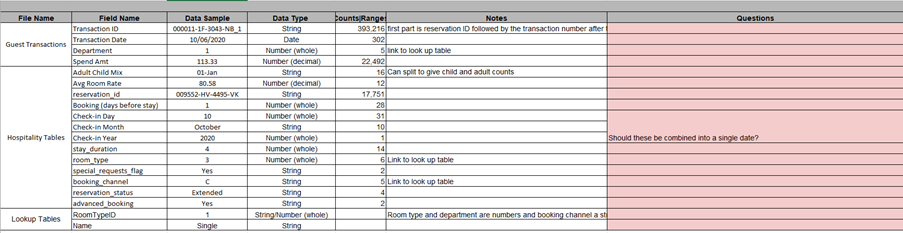
Before making any changes to a dataset, it is crucial to understand and profile the data types of the categories and measures. This step helps in identifying what’s available, how it relates to the overall project objectives, and any potential issues that may need to be addressed.
Some key aspects of this step include:
- Identifying data sources and understanding their structure.
- Examining data types (e.g., categorical and numerical data).
- Checking for missing values, outliers, and duplicates.
- Assessing data quality and consistency across sources.
This is also where planning and documentation play a vital role. Keeping all relevant information in one place ensures that anyone picking up the project work can quickly get up to speed. Proper documentation also makes it easier to communicate findings and requirements with stakeholders.
2) What is the desired state?
To make data useful, it’s important to define the desired state. This was a stage I initially underestimated in our first project—I was eager to jump straight into transformation without first considering what the ideal dataset should look like.
Defining the desired state involves:
- Sketching out the ideal dataset structure.
- Identifying the necessary data fields, data types, and sample values.
- Understanding the end-user needs and how they will interact with the data.
- Anticipating potential data transformations required to align with analysis goals.
By clarifying these elements upfront, you set a clear roadmap for data preparation, reducing the risk of needing to rework or any incorrect assumptions later in the process.
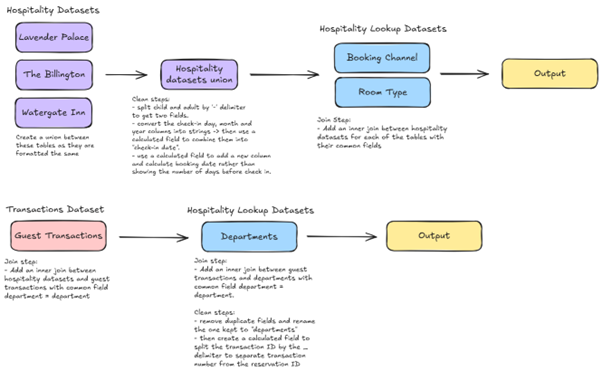
3) Getting to your desired state
Once the desired state is clear, the next step is determining how to reshape and clean the data to match that vision. This step requires a structured approach to ensure logical and efficient transformations:
- Annotating the data to pinpoint necessary changes.
- Listing out transformations in a logical order.
4) The desired state
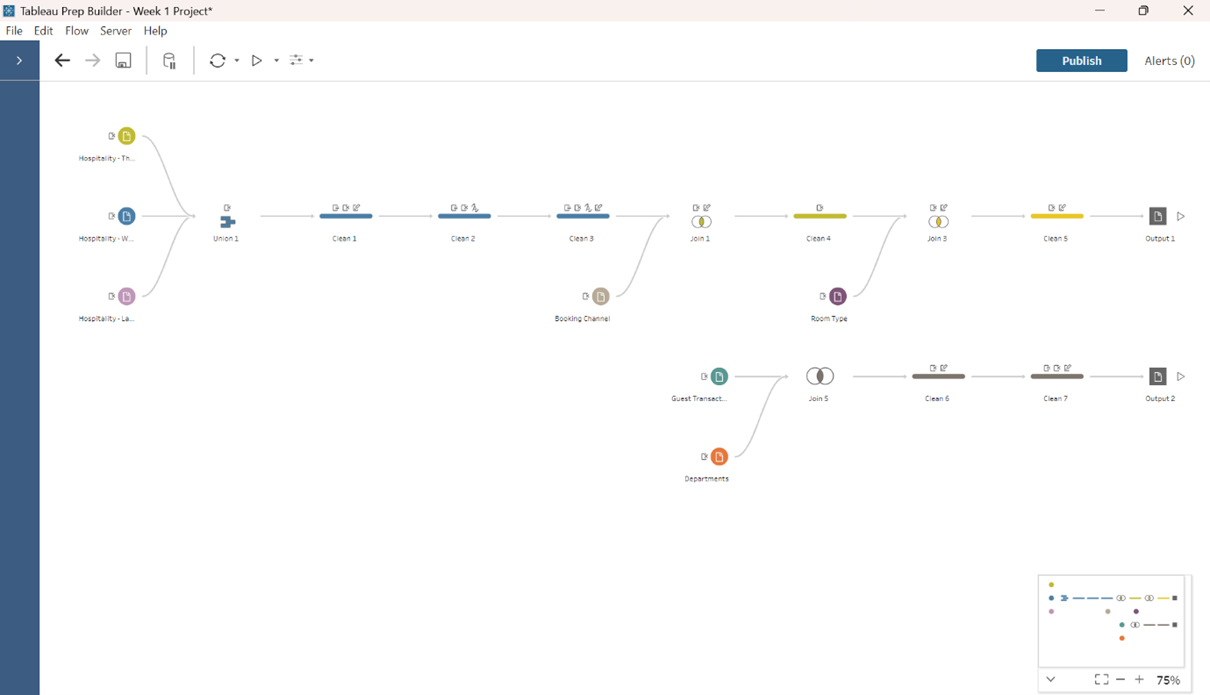
With a solid plan in place, the data can be processed using key transformation techniques to ensure it aligns with project goals and analytical requirements. I applied my learnings in Tableau Prep, executing key techniques such as:
· Unions: Combining datasets with similar structures to streamline analysis.
· Joins: Merging related data from different sources with one of more common fields to create a more comprehensive view.
· Pivoting: Restructuring data to make it more suitable for analysis, such as converting wide datasets into a more manageable long format (columns to rows) or the opposite (rows to columns)
· Cleaning: Removing duplicates, handling null values, and standardising formats to improve data quality.
· Aggregation: Summarising data to the appropriate level of granularity for reporting and decision-making.
By applying these, I was able to transform raw data into two structured outputs in the Tableau Prep workflow below, that aligned with the project objectives, ensuring there would be accuracy and efficiency in any subsequent analysis.
Reflections
Reflecting on my first week, I’ve learned that data work is much more than just making charts and dashboards—it’s about understanding, structuring, and preparing data effectively to support decision-making.
Some of my key takeaways include:
- Never underestimate the importance of data exploration and documentation.
- Clearly define the desired state before making transformations.
- Follow a logical, structured approach when cleaning and shaping data.
- Regularly communicate with stakeholders to ensure alignment with project goals.
With these foundational principles in mind, I’m excited to continue my journey at The Data School and refine my skills in data preparation, analysis, and visualisation.
As I move forward, I’ll be applying these lessons to new projects, always keeping in mind that good data work begins long before the first dashboard is built.