Throughout the training, there have been numerous accomplishments. Some turned out exceptionally well, while others weren't as successful. I'd like to specifically spotlight the work from the client projects. Due to their confidential nature, we couldn't publicly share them in their entirety. However, I will be sharing screenshots of charts and dashboards from select client projects, ensuring that any labels revealing confidential information are omitted.
Below I am showing some of my work for each tool that I used.
1. Tableau :
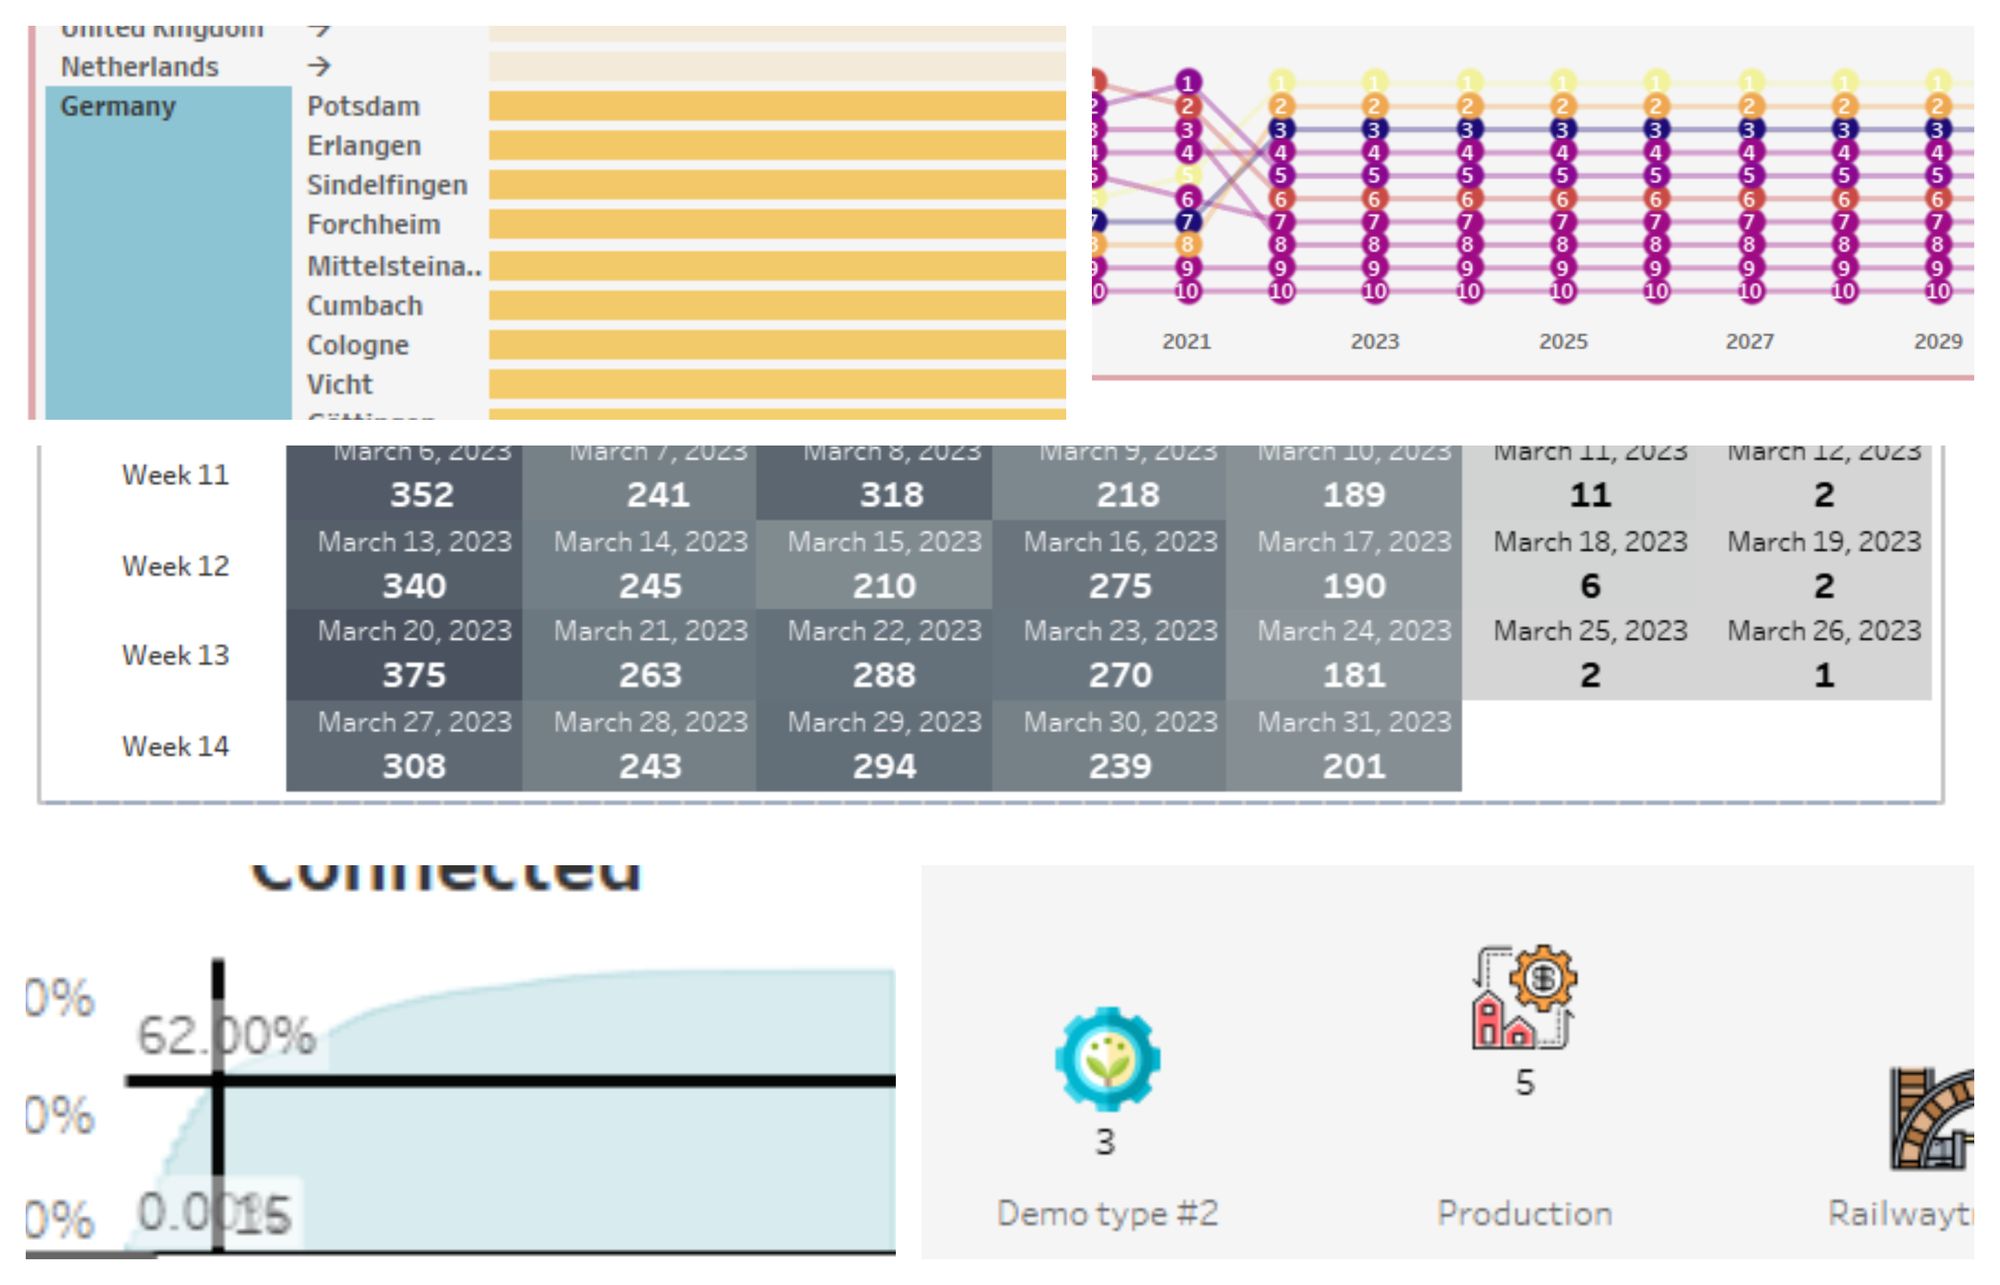
For Tableau Projects, I applied so much from what I learned like advanced Charts, parameters and functions like drill down and highlight functions. Here you can see a mix of chart examples from my work.

2. Power BI:
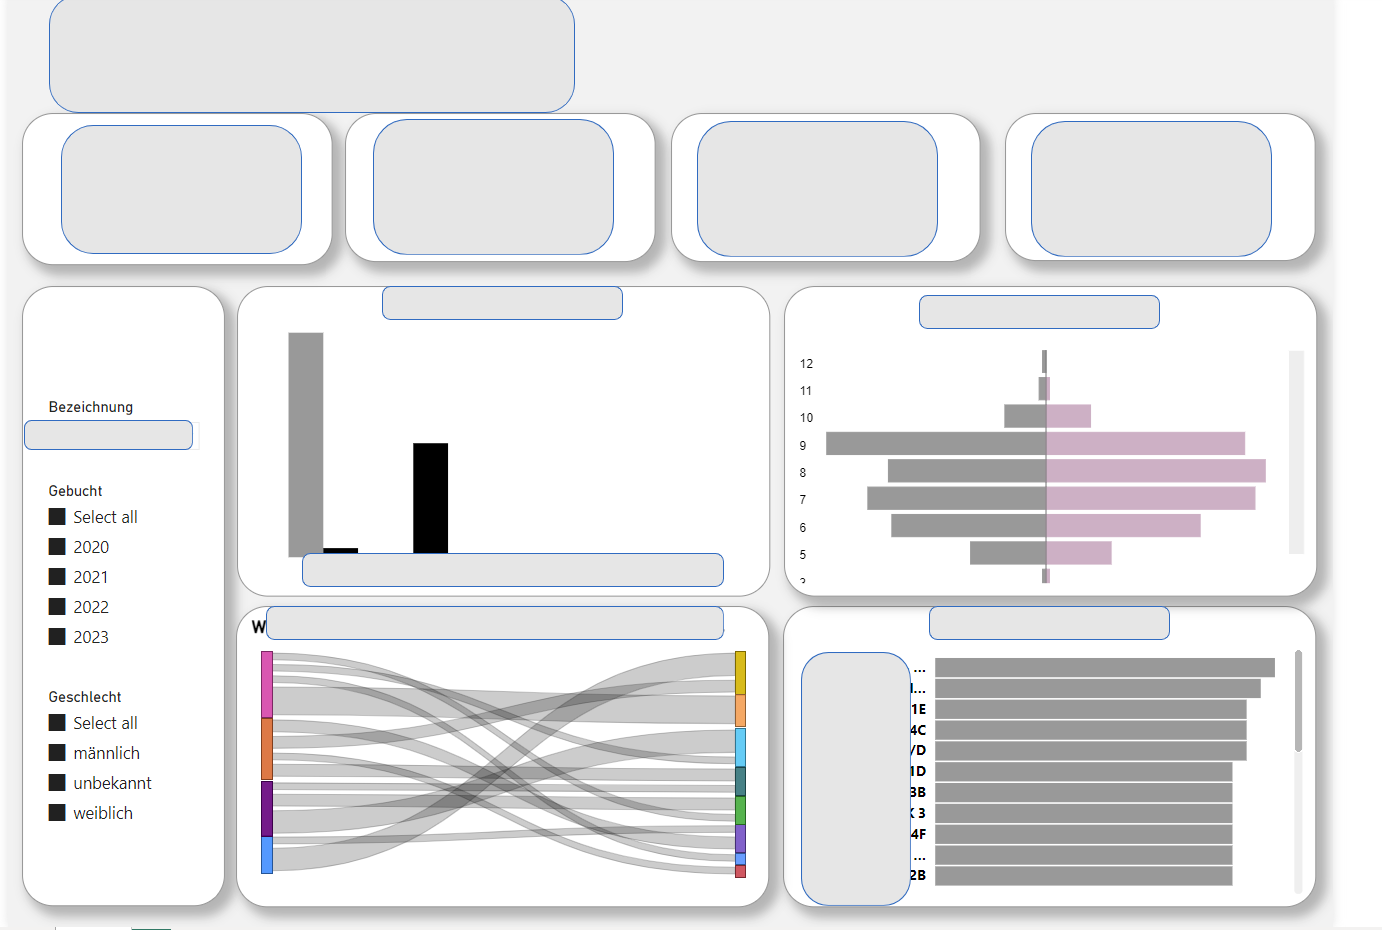
we had a Power BI project after one week intensive Powe Bi training. Working with a new tool and applying the learned material directly after the training was an outstanding experience.
(Labels and titles are hidden)

3. Alteryx:
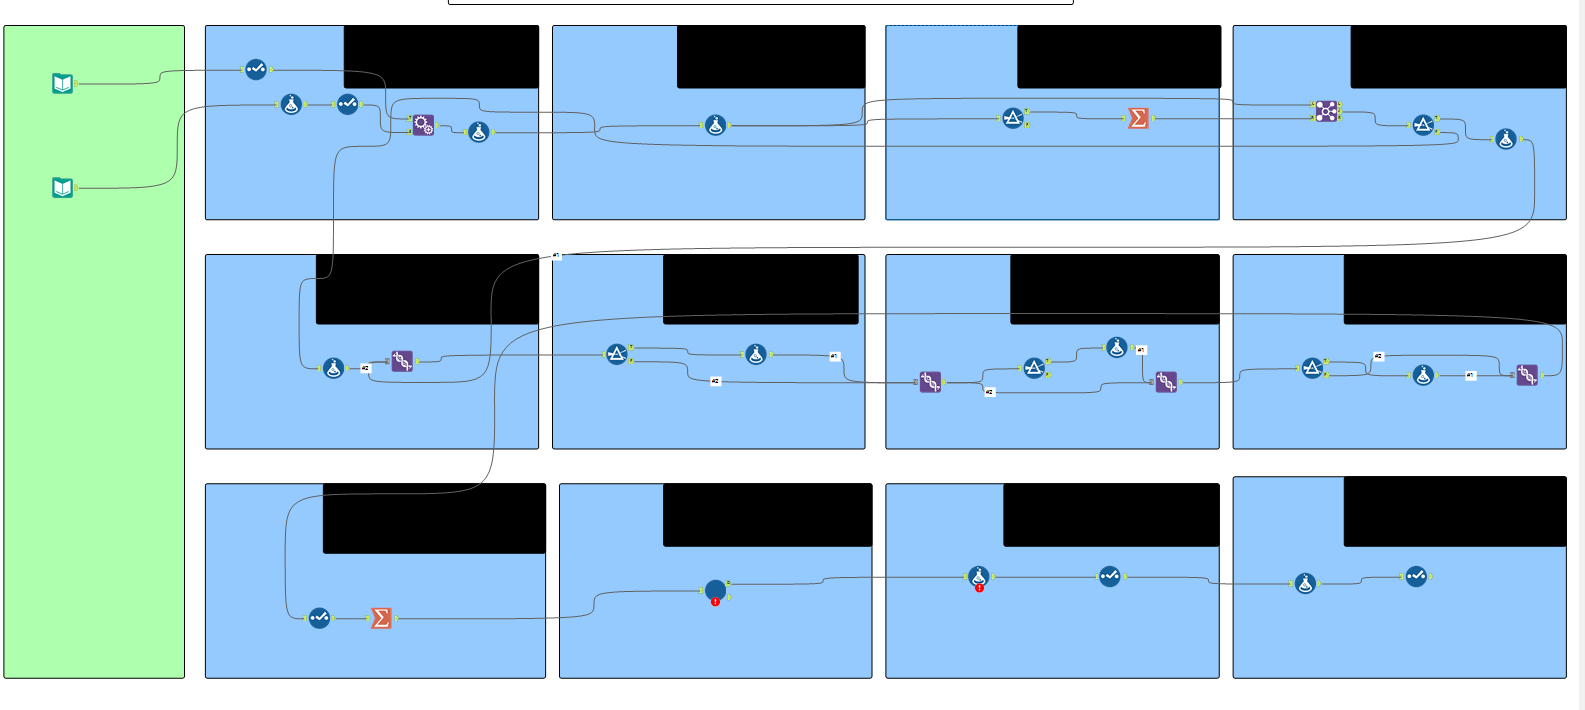
Alteryx for me is like playing a puzzle game. like other tools I use, I dont get bored working with Alteryx. Our very last project was an Alteryx - SQL project. It was intensive hard and fun.

