


In order to show how ones business or anything is performing, it is good to do year on year comparisons. This way we have a large data span and see if the values are increasing or decreasing.
So how do we do this?
TABLE CALCULATION WAY:
Table calcs are by default a lot easier to do. They can be done in either a dynamic or a non dynamic way (best to always go for dynamic).
Non-dynamic: This can be either done with a "paramater" which would give the user the ability to choose what year they want to look at. The parameter would be a simple integer value which can be selected from a list.
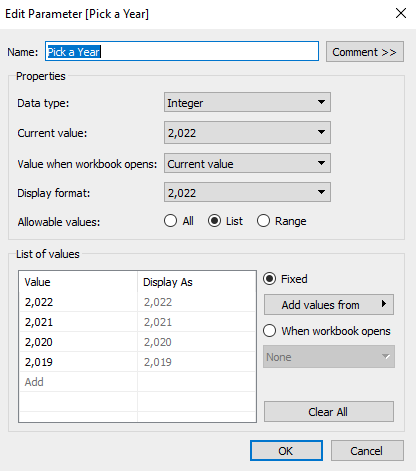
This parameter would be used to drive the selection of current and previous year in a calculation. The calculation would look something like this:
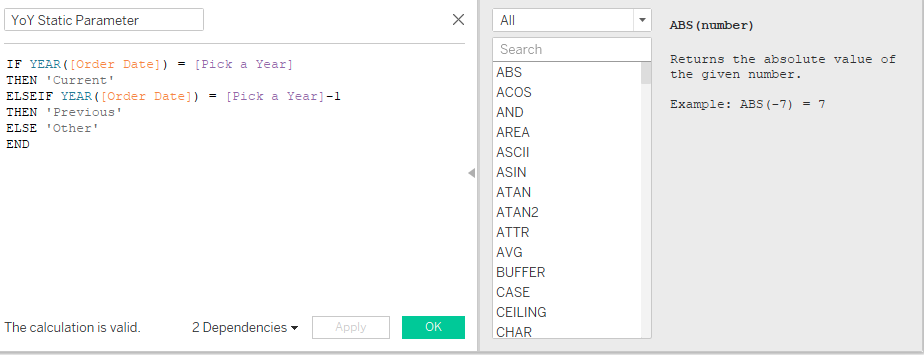
Basically what this is saying if the YEAR of ORDER DATE is equal to the parameter then return this value as 'CURRENT' while the ELSEIF statement just looks one value before and returns it as 'PREVIOUS', everything else is returned as 'OTHER' this is done so values of other years wouldn't be lost from the view.
Now if we add both Year of order date and our created calculation onto rows, we can see how it is interacting with the data:
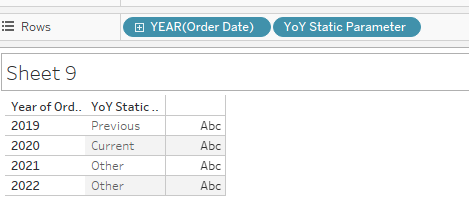
2020 in this case was selected as the current year. From this point onward we can hide the "OTHER" values from the view. This will allow us to keep only current and previous
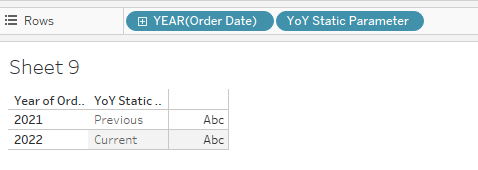
As we can see, I chose to adjust my parameter to 2022 and kept only the two years we want to compare.
From this point onward we can put our Sales onto the ABC and right click on them to find the % difference from previous year.
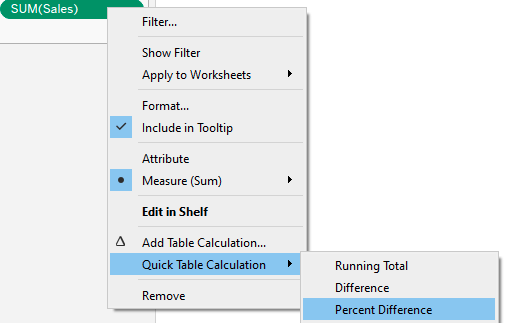
Put everything onto text, format them around and we can find out what was the % difference between 2022 sales and 2021, the added benefit of doing it in this way we can also see what 2021 from 2020 difference was.
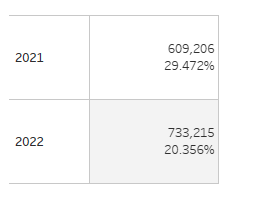
Keep in mind if this is shown to someone, it should be explained why 2019 also has a % difference next to it.
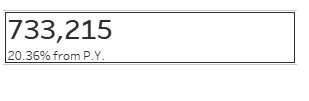
The dynamic way would be to simply put YEAR on columns, put sales on text and use a % difference table calculation as before. Do not forget to put the sales for this year on the view also, just makes it look a bit cleaner. In the end you would end up simply using a LAST filter
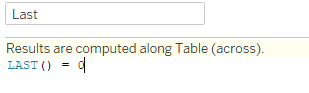
This returns the values only for one specific year in this case the 2022.
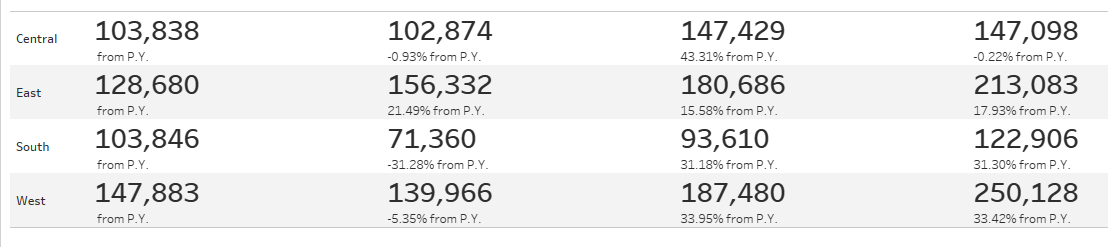
Keep in mind if you add anything else as extra to the view such as regions to split it up, you will have to update the LAST table calculation to reflect it, otherwise it will break your view and show all values like this:
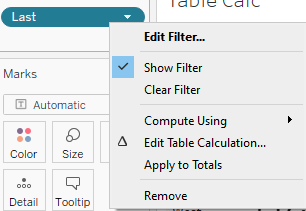
To fix this we right click on last, choose edit table calculation
Choose specific dimensions and select year while deselecting the region.
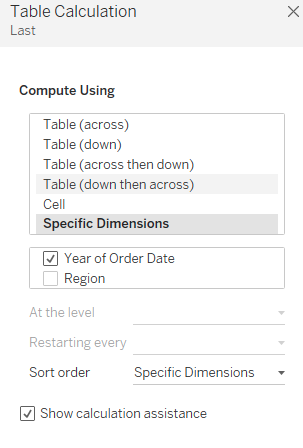
This makes the last() calculation reset every year instead of region, and brings back all the regions at 2022.
Thank you for reading :)