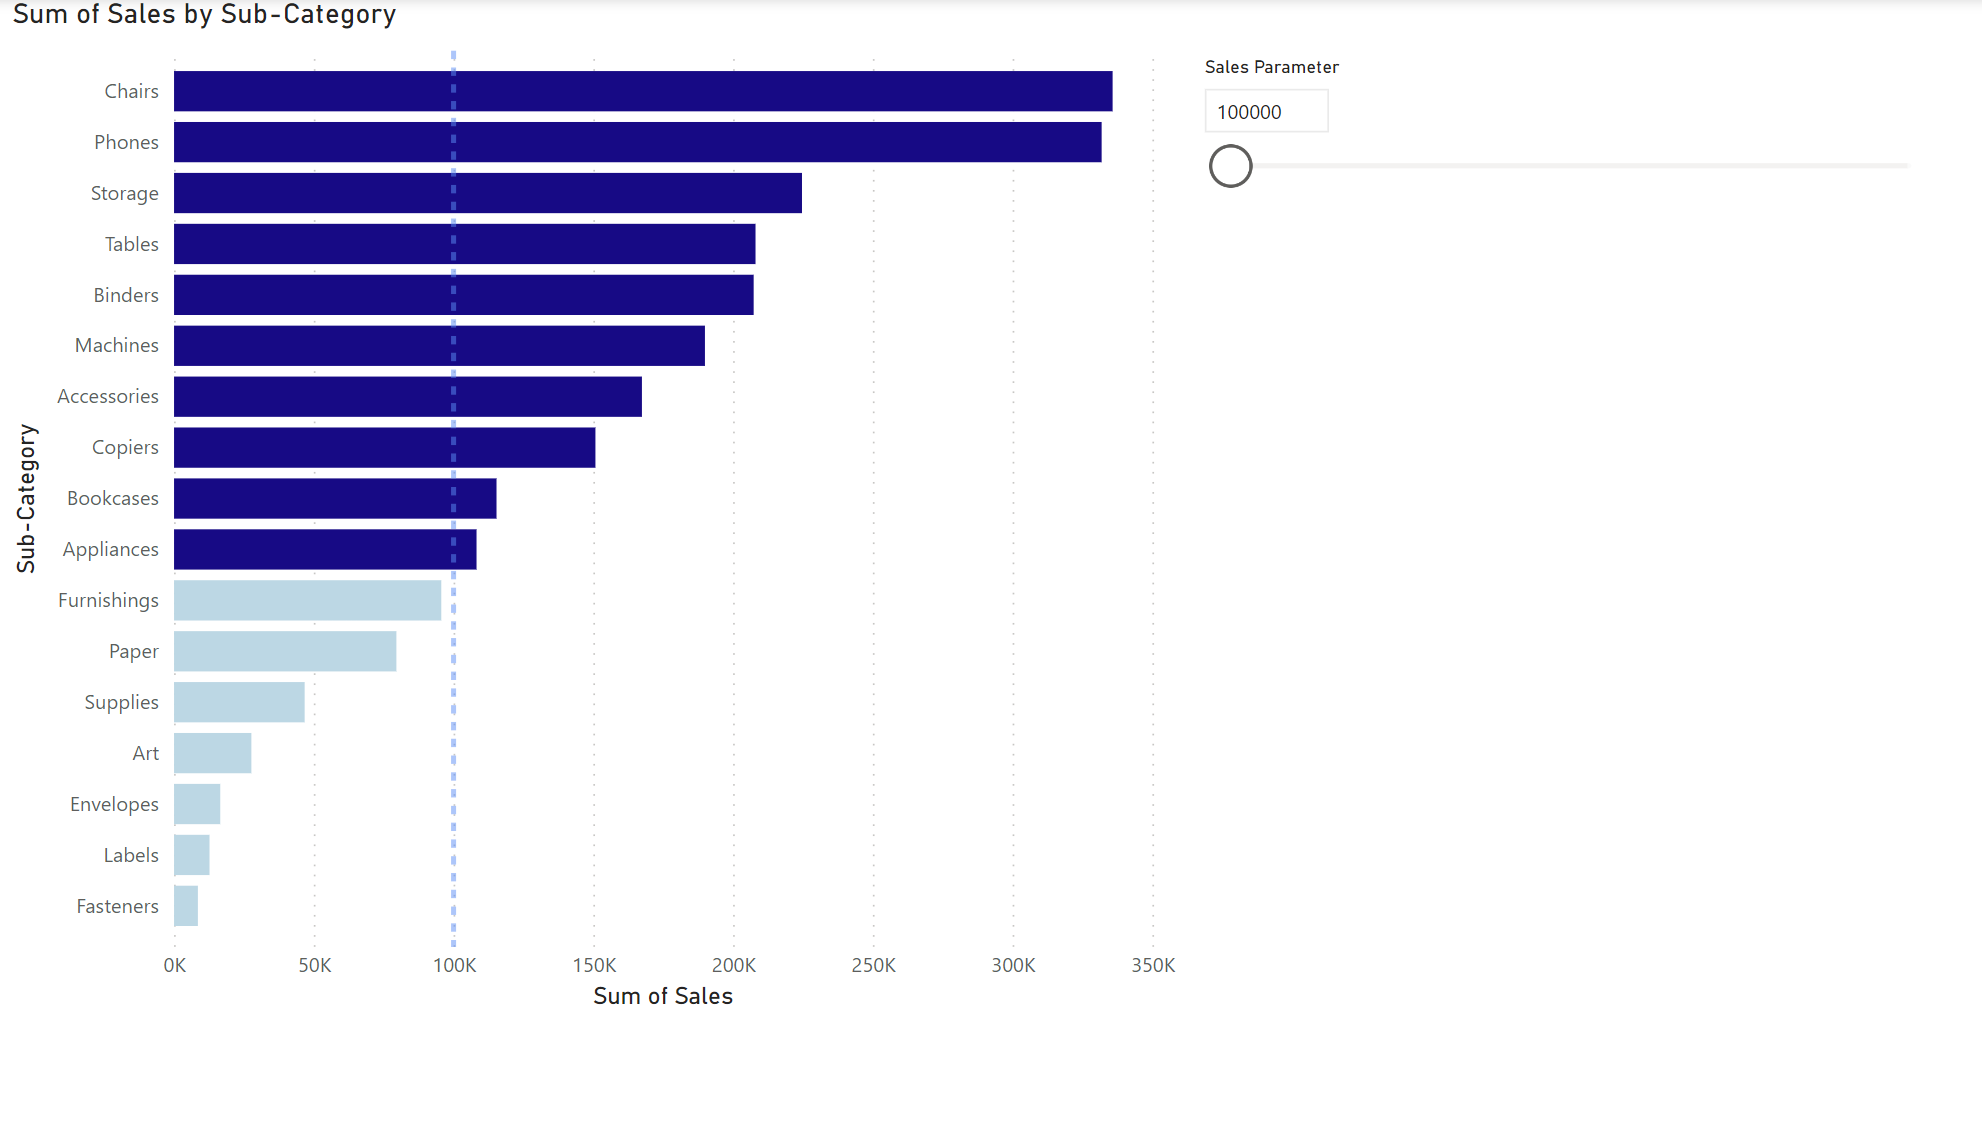
The colouring of this chart is created with string values, here is the code used:
String Above Sales = IF(SUM(Orders[Sales])>= [Sales Parameter Value], "Dark Blue" , "Light Blue")

Code explanation: In DAX you will always start with the name of the calculation created, in this instance I have called it String Above Sales. The calculation always requires an equals symbol to start. In order to differentiate values using colours I have used an IF STATEMENT.
Due to giving the values for the colours in string form ie."Dark Blue", when it comes to choosing the colour scheme using the fx I have selected Field value for format style and selected the DAX calculation for the field this is to be based on. This will automatically take the colour values described in the code and return them on the bars.

...
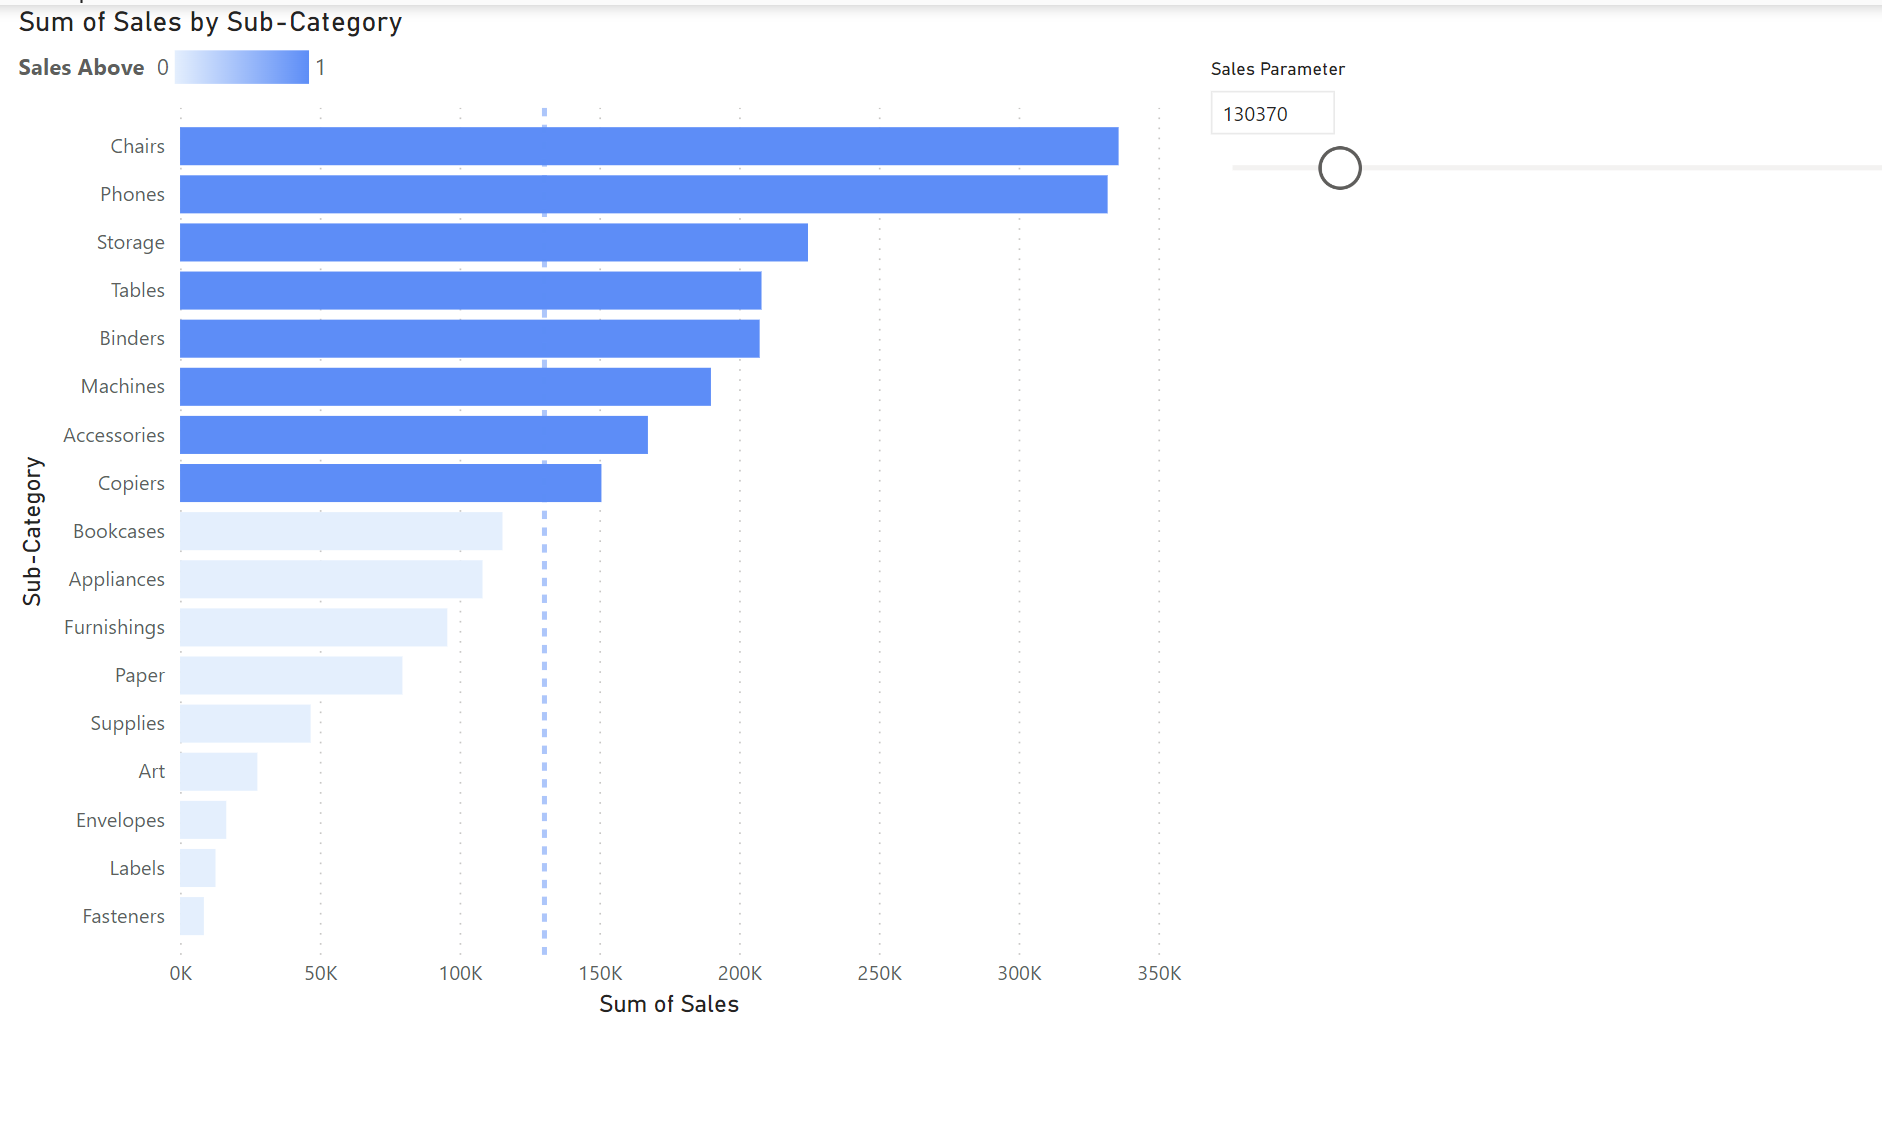
The colouring of this chart is created with integer values, here is the code used:
Sales Above = IF(SUM(Orders[Sales])>= [Sales Parameter Value], 1 , 0)

Code explanation: In DAX you will always start with the name of the calculation created, in this instance I have called it Above Sales. The calculation always requires an equals symbol to start. In order to differentiate values using colours I have used an IF STATEMENT.
Due to giving the values for the colours in an integer form ie. '1' , when it comes to choosing the colour scheme using the fx I have selected Gradient for format style and selected the DAX calculation for the field this gradient is to be based on. This will create a gradient for lowest values to highest. These colours can be manually adjusted.

