


A look at some Tableau Prep steps we learnt last week through an investigation of Chicago homicide data.
The Mystery
Chicago. Multiple murders. A time span of 25 years.
This is Murder at Midnight - an investigation into the patterns within Chicago's homicide data.
This case involves investigating real homicide data, uncovering trends in where and when incidents occurred and understanding how this information could be used to help the Chicago Police Department make better informed decisions regarding resource deployment.
The Evidence
Data on all homicides in Chicago from 2001 to 2026.
Detective's Tools
Before the evidence could be analysed it needed to be reliable. For this investigation Tableau Prep was used to clean and aggregate the data.
Cleaning up the Crime Scene
Firstly, it was important to spend time getting familiar with the evidence. The dataset contained information on individual homicides each having a case number, date, time, location and more.
Once familiar, the evidence needed cleaning. That meant it was time to open Tableau Prep.
Step 1: Checking the Evidence
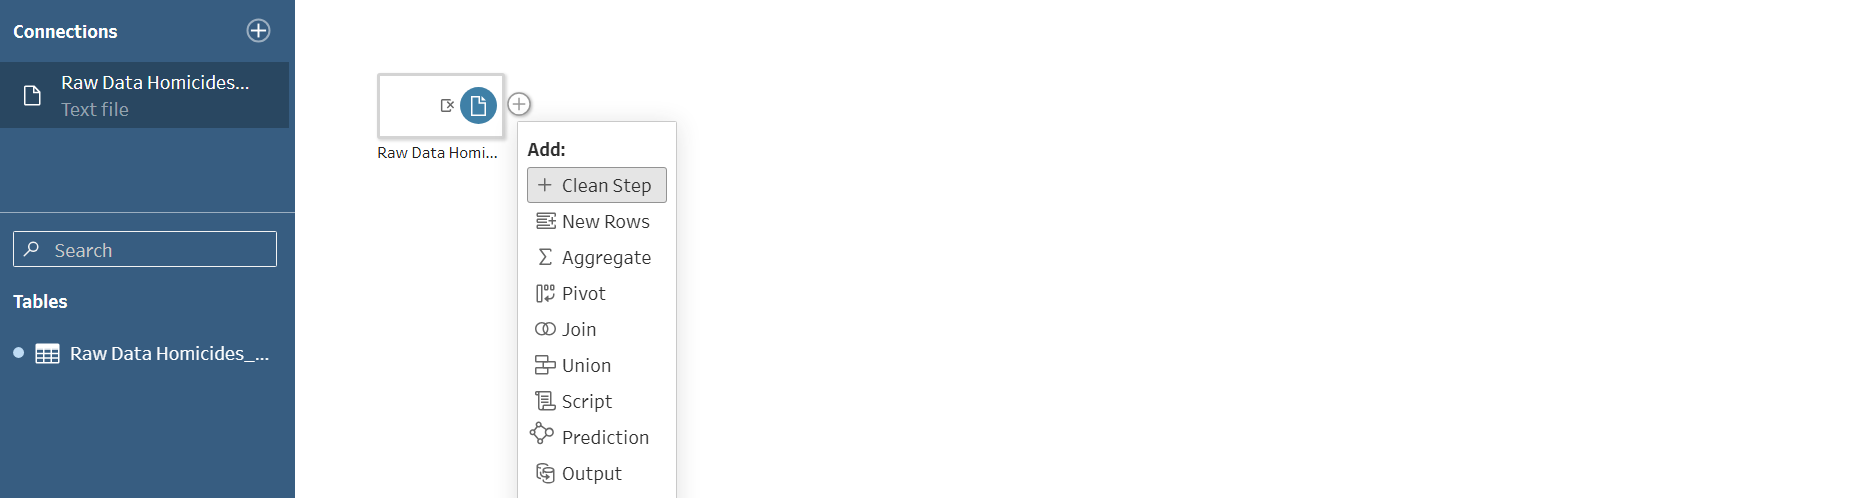
Before following any leads the dataset was loaded into Tableau Prep and a clean step was added.
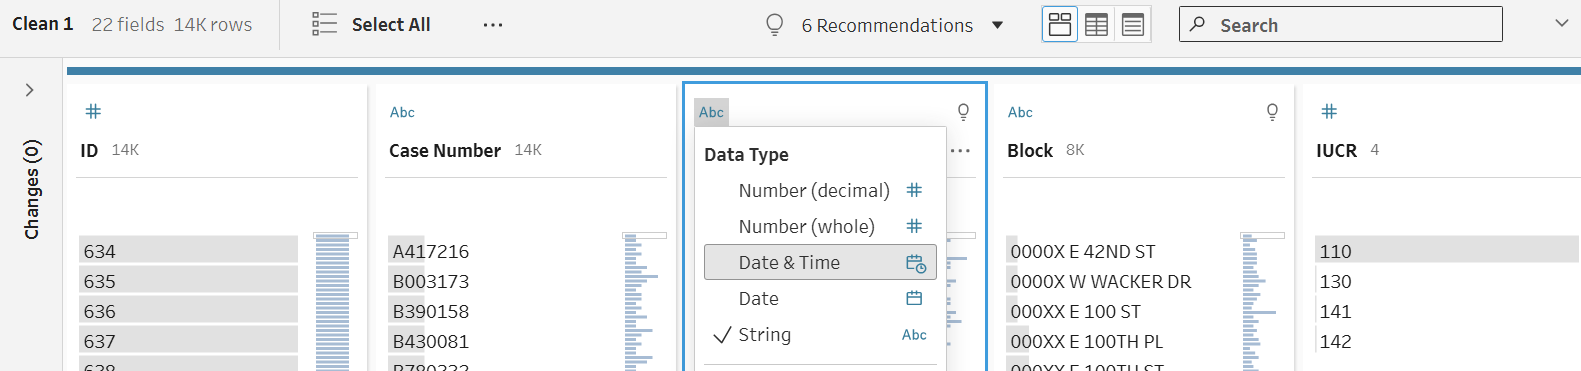
Then the data types assigned to each column were checked and adjusted as needed. Numbers to numbers, text to text and finally dates to dates.
Step 2: Dates of Interest
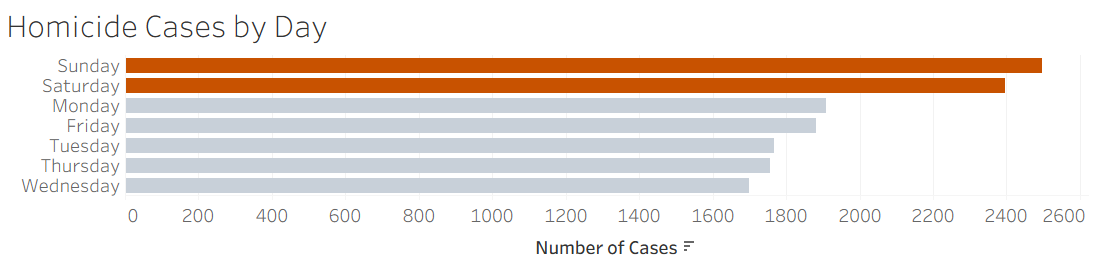
To help the Chicago PD with resource allocation the first question was to assess whether certain days of the week saw more homicides than others?
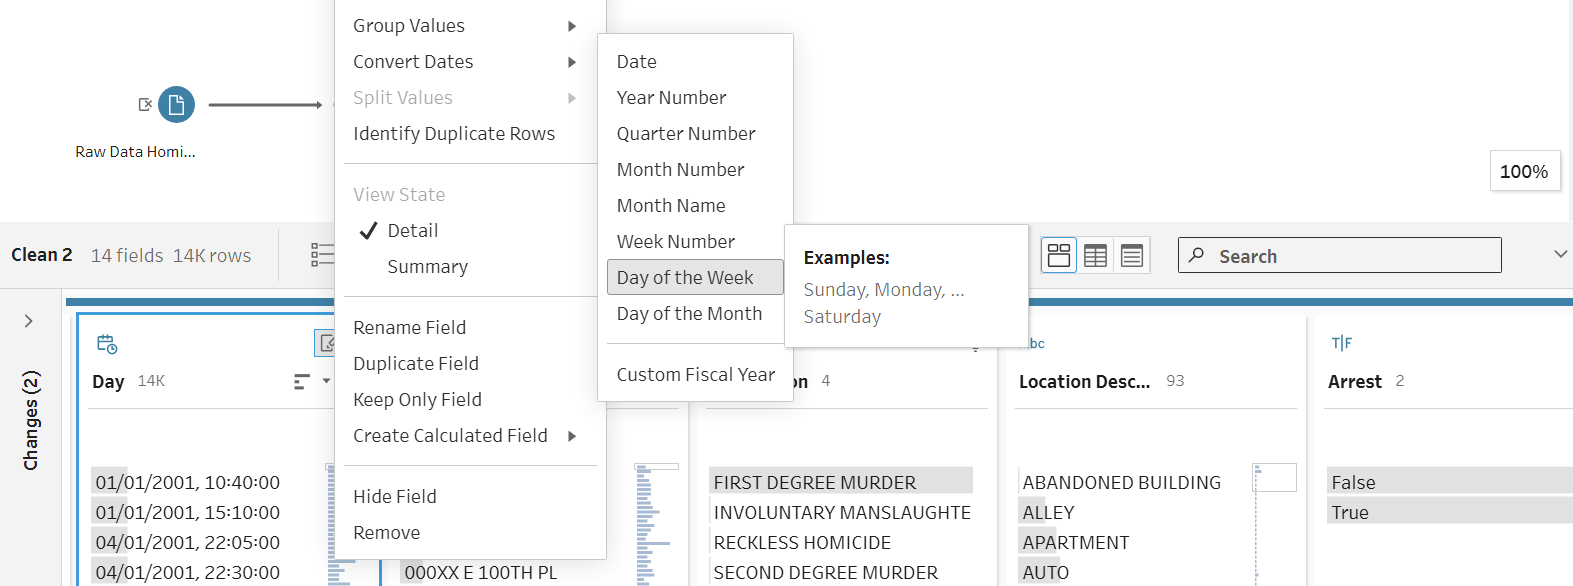
To investigate this the date field was duplicated and then converted to display the day of the week that each homicide occurred. This new field made it possible to identify whether specific days typically saw higher numbers of homicides.
Step 3: Time of the Crime
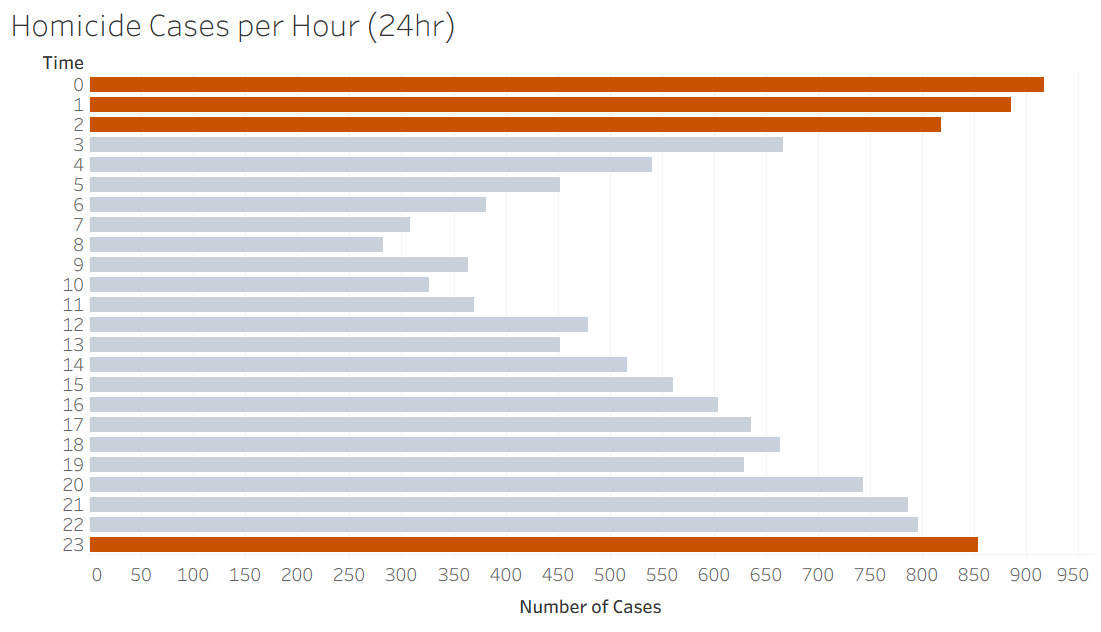
Knowing which day homicides are more likely to occur is useful but the data also allows us to go deeper to focus in on the time of day.
To enable this level of analysis a calculated field was created to extract the hour of day from the recorded homicide time. This allowed homicides to be grouped by hour and helped to identify what times homicides had historically been most frequent.

Step 4: Closing in
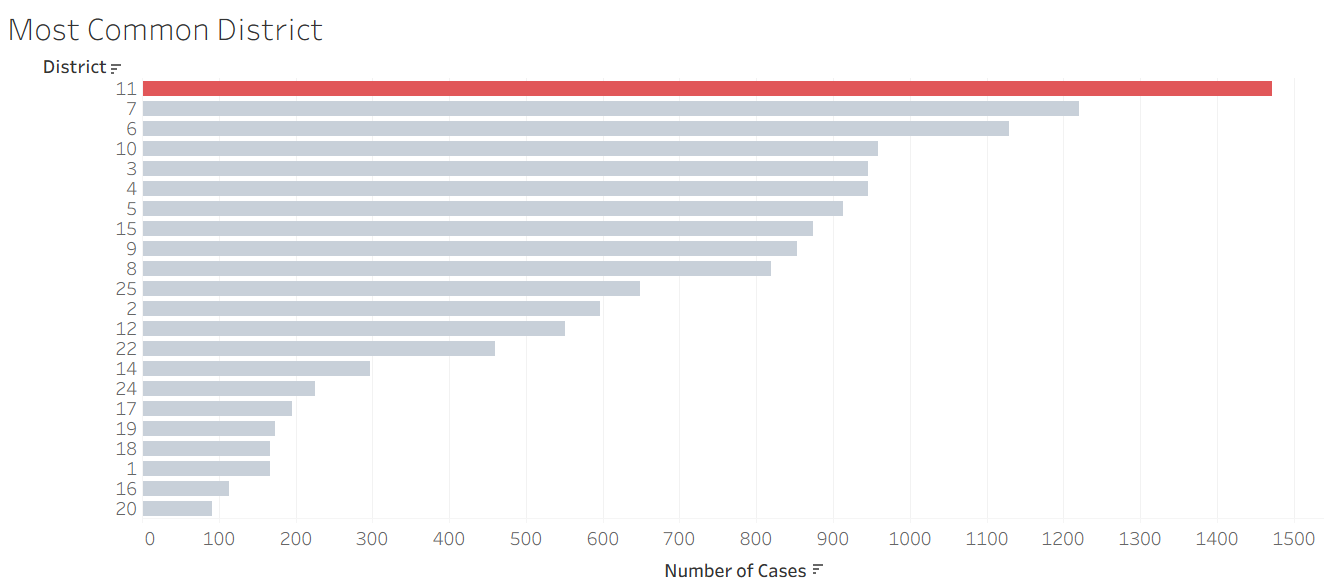
Finally, it was important to follow the geographical evidence.
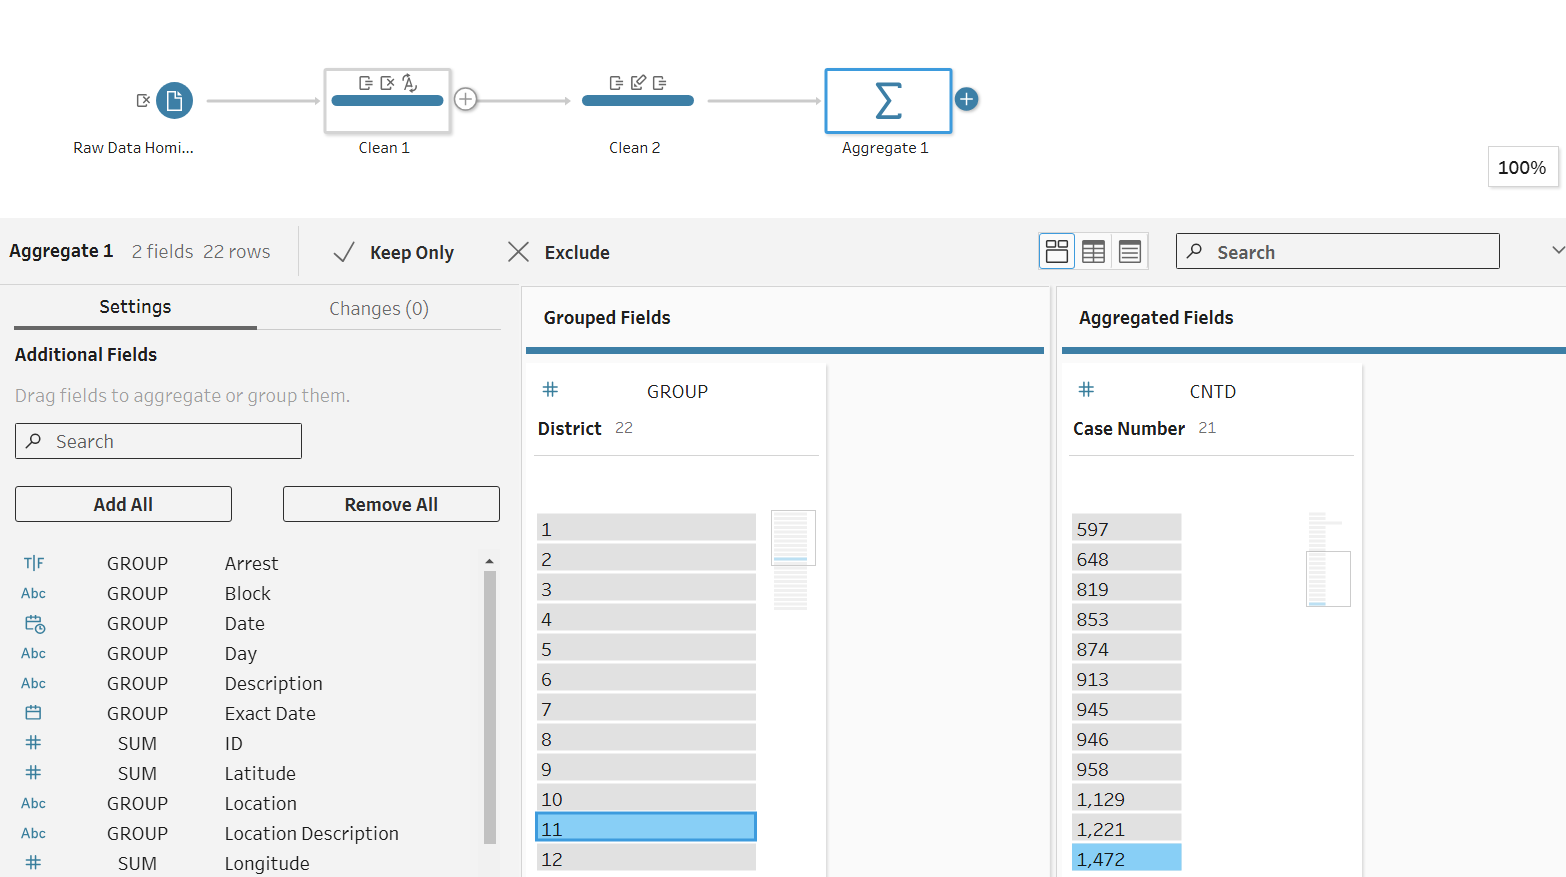
An 'Aggregate' step was added to the Tableau Prep flow to group records by Police District and calculate the number of homicides in each district allowing us to indentify areas with high homicide rates.
The evidence was coming together but the investigation wasn't over yet.
Connecting the Dots
With the data cleaned and aggregated it was time to see where the evidence led and how it could support the Chicago PD.
Clue 1: The Day
Saturday and Sunday emerged as the days with the highest number of recorded homicides. They accounted for 35% of all homicides in the dataset.
Clue 2: The Time
The analysis revealed that 11pm to 3am saw the highest per hour homicide rates.
Clue 3: The Location
The geographical evidence pointed towards Police District 11 which recorded the highest number of homicide cases when compared to other individual districts.
Case closed... almost
So where did the evidence leave us?
For the Chicago PD these findings suggested that resources should deployed more heavily on Saturdays and Sundays between 11pm and 3am, specifically in areas within Police District 11.
There's still more analysis to be done in this investigation so the case isn't quite closed yet but it hopefully points the Chicago PD in the right direction.
The data is real, the story is fictional.