


The task for the final day of Dashboard Week involved uploading Lego data around the theme of Summer into Snowflake, and then cleaning, joining and creating views all in Snowflake. Once the views were created, the task was to create a dashboard using either Tableau or PowerBI. I planned to create a PowerBI dashboard using data related to Spring, Summer, Autumn and Winter, to see how the trends varied against the different themes.
Once I had made a plan of what data I would bring into the dashboard, I then went about planning my SQL query.
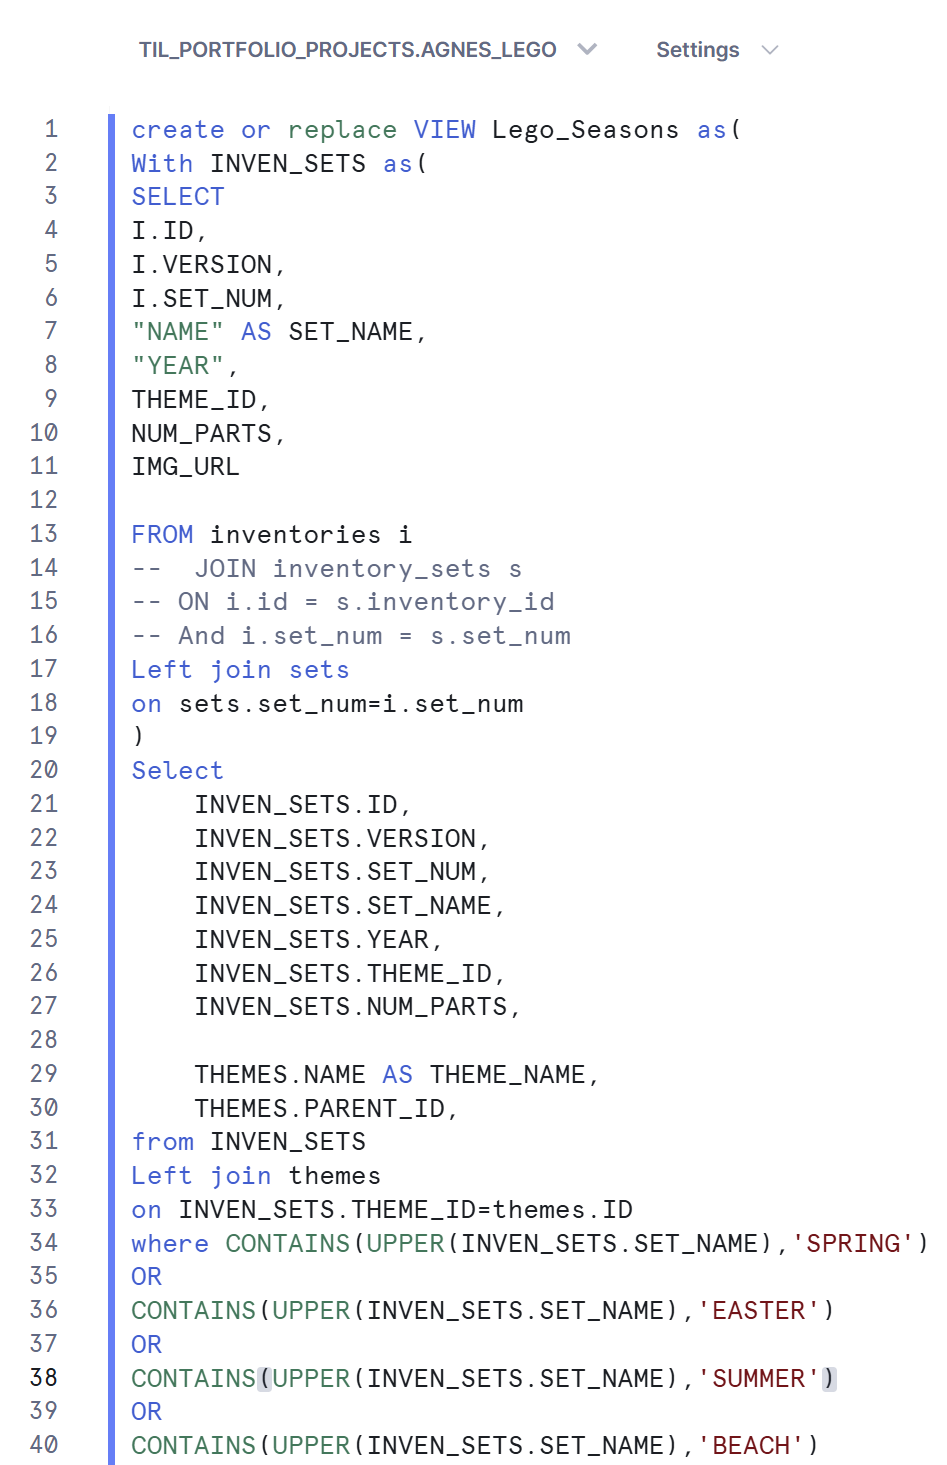
Navigating SQL to process the Snowflake element of the task was quite a challenge to refresh my memory for what was required, and understanding how the tables should be joined together. This involved a lot of trouble shooting, but eventually I managed to achieve establishing two separate views, that I was then able to connect to in PowerBI.
Once the data was imported into Snowflake, then next struggle was the time remaining to analyse the data and to create a dashboard. I really struggled with this part, and would have liked to have had a lot more time available to query the data that I had. I produced quite a straightforward dashboard which I would ultimately like to revisit at some point in the future.