Dispersion is a very broad term when it comes to statistics and can mean many sorts of spread in data (not chocolate spread though - haven't seen that one used yet). Anyways, the point I'm making is rather than giving an overarching definition I'll just define things as and when we need. Today we'll look at variance/standard deviation by explaining how they are calculated and subsequently, what they are.
How are Variance and Standard Deviation Calculated
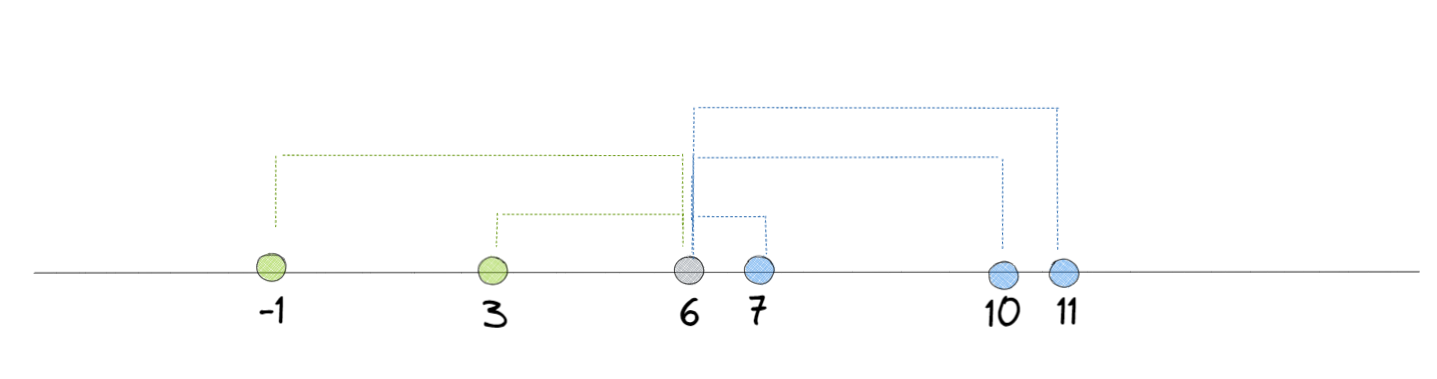
Let's start off with an simple number line. There are five points (-1,3,7,10 and 11). The mean of these numbers is also displayed in grey (-6). Let's say I wanted to work out how far away all the points are from the mean, a simple way to do that would just be to work out the difference between both (e.g. 7 - 6 = 1). If we do that we get -7,-3,1,4 and 5 by subtracting the mean from the individual points. Okay so now what. Well we could work out the average of these numbers but how should we treat the positives and negatives, since in theory, they will cancel each-other out.
Instead of just taking an average of these numbers, we can square them first so that they are all positive. This is exactly how variance is calculated. So to finish the calculation off if we square all the numbers and get 49,9,1,16,25. The average of these numbers is 20. The spread of all the data is 20 - doesn't really mean much does it. If we square root this number we can work out the average distance away from the mean (which is what standard deviation measures). This time we can say that each point on average is 4.47 away from the mean. Still doesn't mean much but that's because there's no context to the values. If we could say something like, the average person is either 4.47cm above or below the mean height of 6cm, that is valuable information (admittedly a terrible example but YGWIM). All that's left to do is add the scientific equations for both below and we can call it a day.
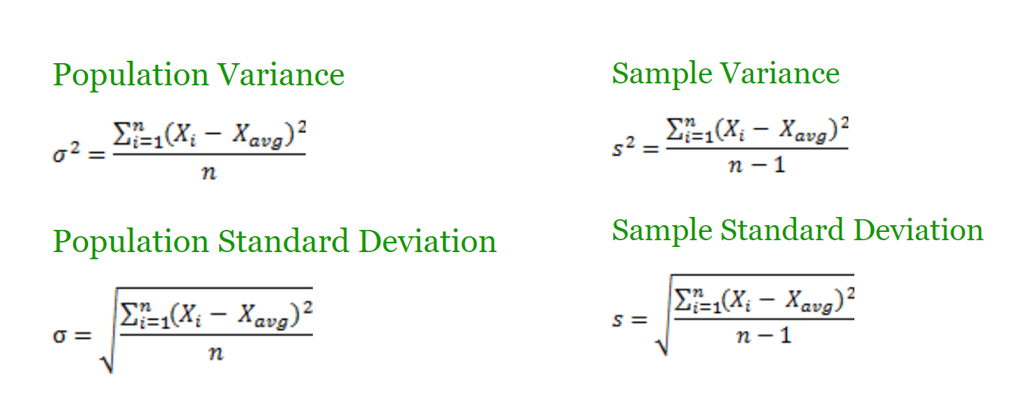
There we have it, we've covered variance, standard deviation and wait a sec … why are there four equations and what's this Population/Sample nonsense. Well you see, how we work things out depends on whether we have all the data available (population), or just a subset (sample). The population equations are what we're used to so I'll skip those and focus on the sample equations - more specifically why we divide by n-1 instead of n when working out the average.
Why we don't divide the sample variance by n
There's a lot of complicated maths explaining why Sample standard variance is unbiased etc but in the words of T'Challa 'We don't do that here.' So instead we'll just focus on the logic instead of the actual details. Normally we use a sample to represent a subset of a population like so.
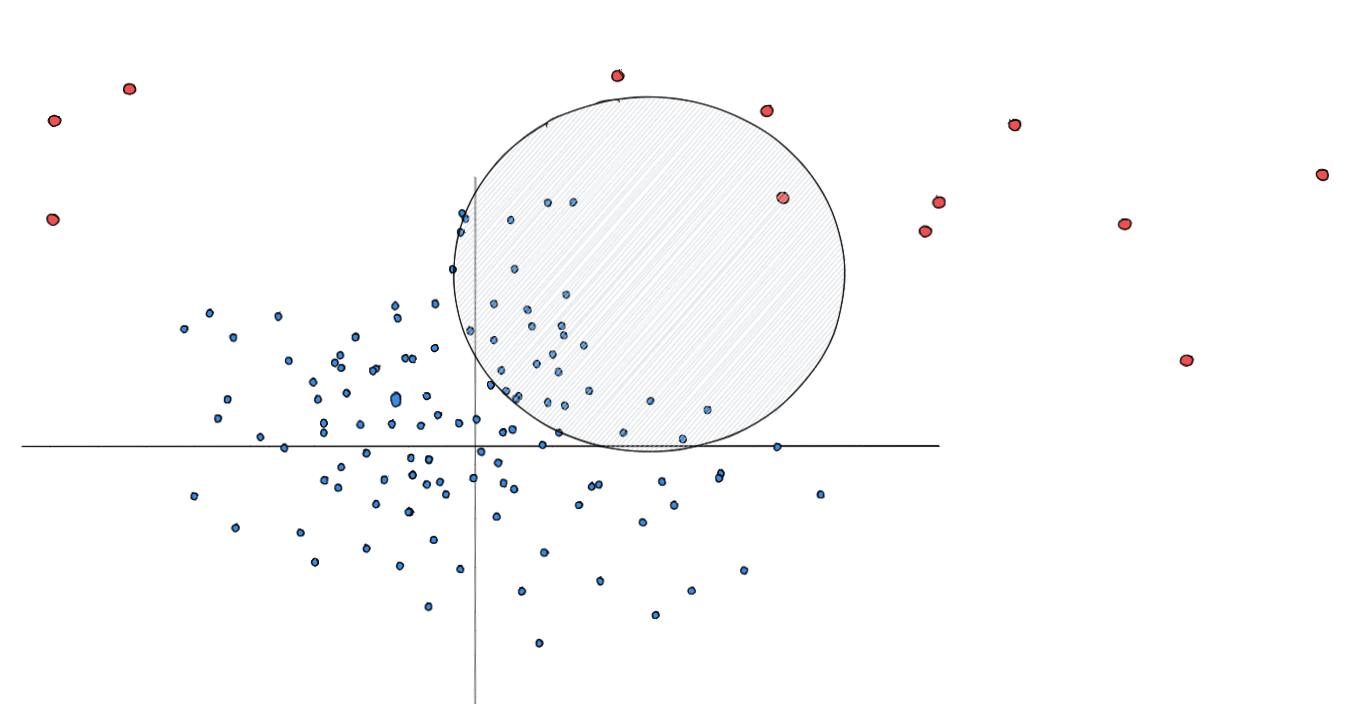
Here each dot represents the members of a population. The red dots are those we'd consider outliers and the circle represents a random sample that we could take. The problem is that when we sample a population it's unlikely that we capture a proportionate amount of outliers/normal values. Therefore, when we calculate sample variance the spread is disproportionately smaller than the variance of the population would have been - since we lose a lot of the data that would contribute to large amounts of spread. To get around that we divide the sum of the squared differences by a smaller number than we do for the population (n-1 instead of n). Doing so should help remove some of the imbalance and make the sample a better predictor of the population.
I'm aware that may be a bit confusing but hopefully you managed to follow along. Supposedly, there's a way to leave comments so if you're still unsure do leave me a message and I'll see if I can better explain it.